
Compare KN Agri Resource with Similar Stocks
Dashboard
Weak Long Term Fundamental Strength with an average Return on Equity (ROE) of 9.52%
- Poor long term growth as Net Sales has grown by an annual rate of 6.90% and Operating profit at 4.76% over the last 5 years
Flat results in Mar 26
Despite the size of the company, domestic mutual funds hold only 0% of the company
Below par performance in long term as well as near term
Stock DNA
Other Agricultural Products
INR 502 Cr (Micro Cap)
13.00
35
0.00%
0.07
8.24%
1.29
Total Returns (Price + Dividend) 
KN Agri Resource for the last several years.
Risk Adjusted Returns v/s
Returns Beta

News
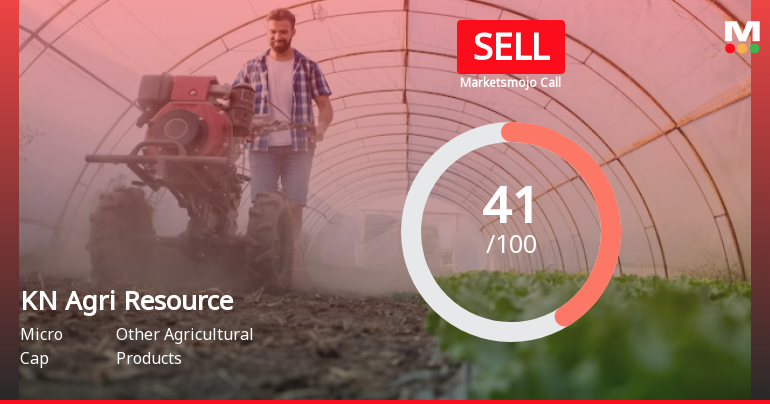
KN Agri Resources Ltd is Rated Sell
KN Agri Resources Ltd is rated 'Sell' by MarketsMOJO, with this rating last updated on 02 July 2026. However, the analysis and financial metrics discussed here reflect the stock's current position as of 16 July 2026, providing investors with the latest insights into its performance and outlook.
Read full news article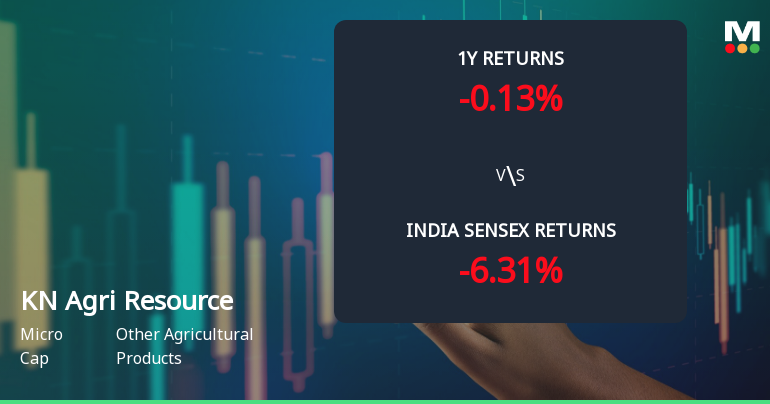
KN Agri Resources Ltd Shows Mixed Technical Signals Amid Mildly Bullish Momentum
KN Agri Resources Ltd, a micro-cap player in the Other Agricultural Products sector, has recently exhibited a subtle shift in its technical momentum, moving from a mildly bearish stance to a mildly bullish trend. Despite a slight dip in the stock price, the technical indicators present a nuanced picture, reflecting both optimism and caution for investors navigating this agricultural stock.
Read full news article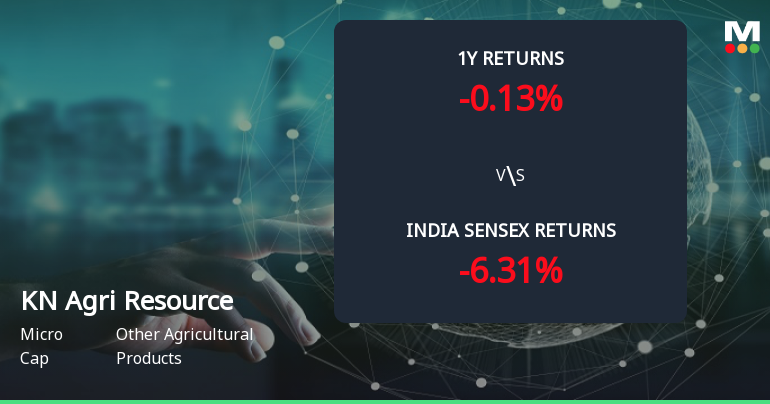
Golden Cross Forms in KN Agri Resources Ltd Amid Mixed Technical Signals
The 50-day moving average has crossed above the 200-day moving average for KN Agri Resources Ltd, signalling a golden cross on 7 Jul 2026. Yet, the stock declined 0.62% on the day the cross formed, while monthly momentum indicators remain bearish. This juxtaposition of signals calls for a detailed examination of the technical and fundamental context behind the crossover.
Read full news article Announcements
Corporate Actions

No Upcoming Board Meetings

No Dividend history available

No Splits history available

No Bonus history available

No Rights history available
Quality key factors
Valuation key factors
Technicals key factors
 Technical Indicator Scale: Bearish, Mildly Bearish, Sideways, Mildly Bullish, Bullish Turned
 Shareholding Snapshot : Mar 2026
Shareholding Compare (%holding)
Promoters
None
Held by 0 Schemes
Held by 5 FIIs (3.11%)
Anant Counter Trade Pvt Ltd (22.89%)
Singularity Holdings Limited (4.38%)
13.11%
Quarterly Results Snapshot (Standalone) - Mar'26 - QoQ

QoQ Growth in quarter ended Mar 2026 is -6.18% vs 17.13% in Dec 2025

QoQ Growth in quarter ended Mar 2026 is 150.10% vs 11.23% in Dec 2025
Half Yearly Results Snapshot (Consolidated) - Sep'25
Growth in half year ended Sep 2025 is -15.49% vs 28.74% in Mar 2025
Growth in half year ended Sep 2025 is -38.27% vs 58.26% in Mar 2025
Nine Monthly Results Snapshot (Consolidated) - Dec'25
YoY Growth in nine months ended Dec 2025 is 7.94% vs 10.48% in Mar 2026
YoY Growth in nine months ended Dec 2025 is -29.24% vs 9.33% in Mar 2026
Annual Results Snapshot (Consolidated) - Mar'26
YoY Growth in year ended Mar 2026 is 5.17% vs 1.48% in Mar 2025
YoY Growth in year ended Mar 2026 is -14.49% vs 19.40% in Mar 2025
About KN Agri Resources Ltd

Company Coordinates


