

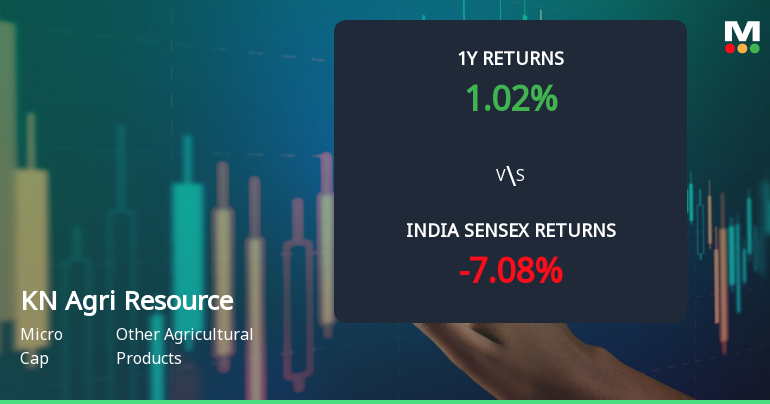
Key Events This Week
29 Jun: Week opens at Rs.210.57
2 Jul: Valuation shifts signal renewed price attractiveness
3 Jul: Technical momentum shifts amid mixed signals
3 Jul: Week closes at Rs.211.53 (+0.46%)
KN Agri Resources Ltd Sees Technical Momentum Shift Amid Mixed Market Signals
2026-07-03 08:05:44KN Agri Resources Ltd has exhibited a notable shift in its technical momentum, moving from a mildly bearish stance to a sideways trend, reflecting a complex interplay of bullish and bearish signals across key technical indicators. Despite a recent 2.32% gain in daily price, the micro-cap agricultural stock continues to face challenges amid mixed momentum cues and a cautious market outlook.
Read full news article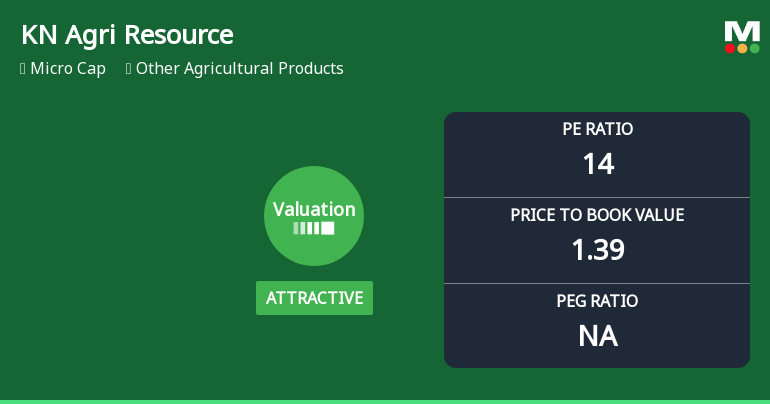
KN Agri Resources Ltd Valuation Shifts Signal Renewed Price Attractiveness
2026-07-02 08:05:32KN Agri Resources Ltd has seen a notable shift in its valuation parameters, moving from a fair to an attractive rating, despite a challenging sector backdrop and a micro-cap status. This change reflects improved price-to-earnings and price-to-book value ratios relative to its historical averages and peer group, signalling a potential opportunity for value-focused investors amid broader market volatility.
Read full news article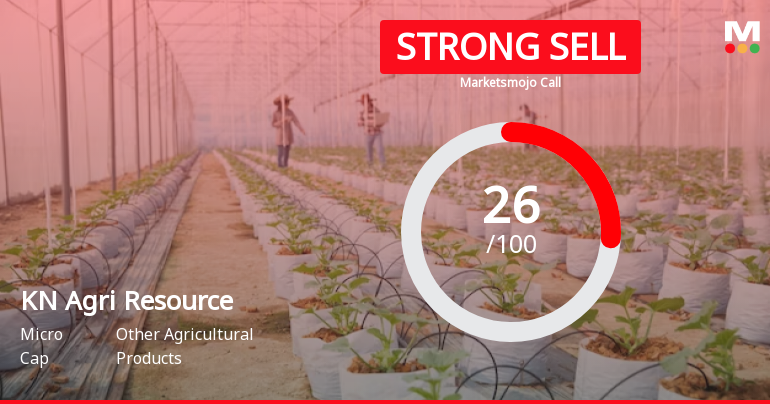
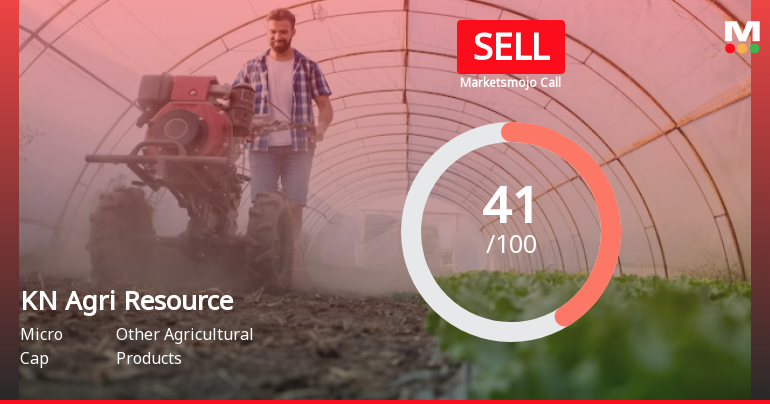
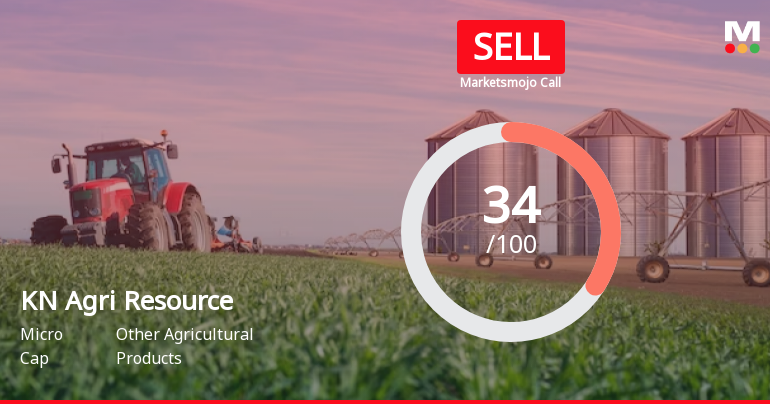
KN Agri Resources Ltd is Rated Strong Sell
2026-06-24 10:10:25KN Agri Resources Ltd is rated Strong Sell by MarketsMOJO. This rating was last updated on 02 June 2026. However, the analysis and financial metrics presented here reflect the stock’s current position as of 24 June 2026, providing investors with the most up-to-date view of the company’s fundamentals, returns, and market standing.
Read full news article


