
Compare Konndor Indust. with Similar Stocks
Dashboard
Weak Long Term Fundamental Strength as the company has not declared results in the last 6 months
- Company's ability to service its debt is weak with a poor EBIT to Interest (avg) ratio of 0.54
- The company has been able to generate a Return on Equity (avg) of 4.93% signifying low profitability per unit of shareholders funds
Flat results in Dec 25
Risky - Negative EBITDA
Stock DNA
Paper, Forest & Jute Products
INR 9 Cr (Micro Cap)
NA (Loss Making)
23
0.00%
0.00
-0.31%
0.90
Total Returns (Price + Dividend) 
Konndor Indust. for the last several years.
Risk Adjusted Returns v/s
Returns Beta

News
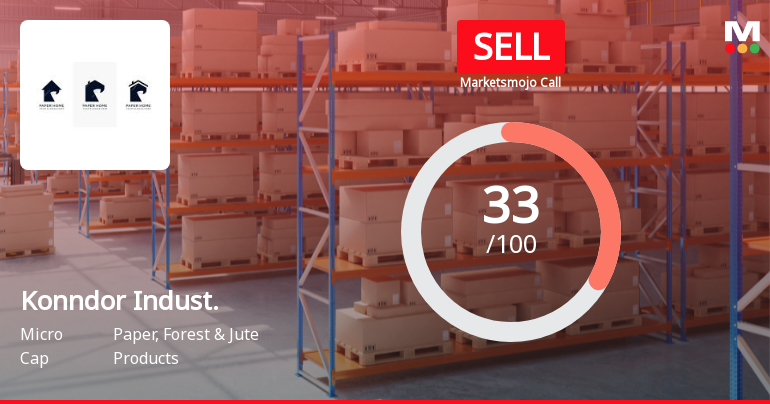
Konndor Industries Ltd Upgraded to Sell on Technical Improvements Despite Weak Fundamentals
Konndor Industries Ltd, a micro-cap player in the Paper, Forest & Jute Products sector, has seen its investment rating upgraded from Strong Sell to Sell as of 9 July 2026. This change is primarily driven by a shift in technical indicators, despite ongoing fundamental challenges and weak financial trends. The company’s Mojo Score now stands at 33.0, reflecting a cautious but slightly improved outlook.
Read full news article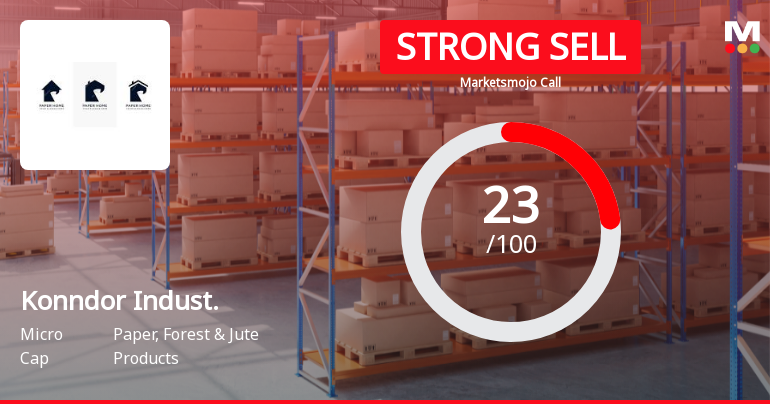
Konndor Industries Ltd Downgraded to Strong Sell Amid Technical and Financial Weaknesses
Konndor Industries Ltd, a micro-cap player in the Paper, Forest & Jute Products sector, has seen its investment rating downgraded from Sell to Strong Sell as of 29 June 2026. This shift reflects deteriorating technical indicators and persistent fundamental weaknesses, despite the stock’s recent outperformance relative to the broader market. Investors should carefully consider the multi-faceted reasons behind this downgrade before making portfolio decisions.
Read full news article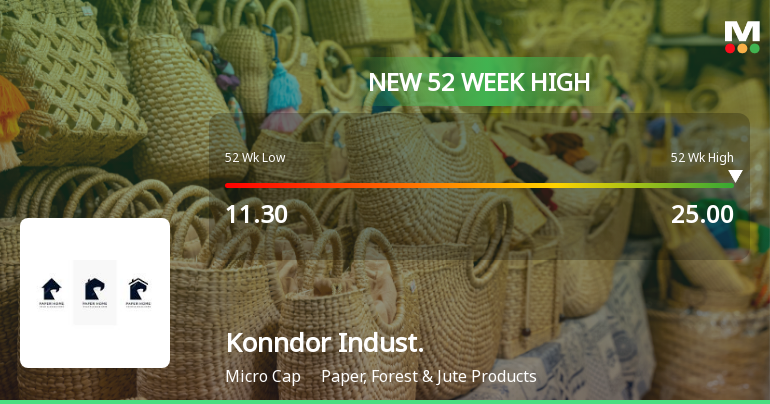
Broad-Based Technical Strength Lifts Konndor Industries Ltd to 52-Week High of Rs 25
Surging past its previous peaks, Konndor Industries Ltd reached a fresh 52-week high of Rs 25 on 22 Jun 2026, marking a remarkable rally of nearly 122% from its 52-week low of Rs 11.3. This milestone caps a six-day winning streak that has propelled the stock well above key moving averages, underscoring strong price momentum and technical conviction.
Read full news article Announcements
Announcement under Regulation 30 (LODR)-Change in Registered Office Address
13-Jul-2026 | Source : BSEChange of Registered Office within local Limit of City.
Closure of Trading Window
26-Mar-2026 | Source : BSEClosing of trading window for the quarter and annual audited financial results ended 31.03.2026.
Board Meeting Outcome for Outcome Of Board Meeting Of Resignation Of Mr. Vimal Mafatlal Patel As A Director.
06-Mar-2026 | Source : BSEOutcome of Board meeting of Resignation of Mr. Vimal Mafatlal Patel as a Director.
Corporate Actions

No Upcoming Board Meetings

No Dividend history available

No Splits history available

No Bonus history available

No Rights history available
Quality key factors
Valuation key factors
Technicals key factors
 Technical Indicator Scale: Bearish, Mildly Bearish, Sideways, Mildly Bullish, Bullish Turned
 Shareholding Snapshot : Dec 2025
Shareholding Compare (%holding)
Non Institution
None
Held by 0 Schemes
Held by 0 FIIs
None
Yashashri Subodh Jadhav (19.24%)
71.69%
Quarterly Results Snapshot (Standalone) - Dec'25 - QoQ

QoQ Growth in quarter ended Dec 2025 is 0.00% vs -100.00% in Sep 2025

QoQ Growth in quarter ended Dec 2025 is 0.00% vs 100.00% in Sep 2025
Half Yearly Results Snapshot (Standalone) - Sep'25
Growth in half year ended Sep 2025 is -60.46% vs -30.62% in Sep 2024
Growth in half year ended Sep 2025 is -102.99% vs 26.42% in Sep 2024
Nine Monthly Results Snapshot (Standalone) - Dec'25
YoY Growth in nine months ended Dec 2025 is -75.16% vs -27.04% in Dec 2024
YoY Growth in nine months ended Dec 2025 is -103.80% vs 6.76% in Dec 2024
Annual Results Snapshot (Standalone) - Mar'25
YoY Growth in year ended Mar 2025 is -35.61% vs 19.60% in Mar 2024
YoY Growth in year ended Mar 2025 is 1.56% vs 137.04% in Mar 2024
About Konndor Industries Ltd

Company Coordinates


