
Compare KPT Industries with Similar Stocks
Stock DNA
Industrial Manufacturing
INR 145 Cr (Micro Cap)
12.00
37
0.69%
0.29
15.73%
1.88
Total Returns (Price + Dividend) 
Latest dividend: 3 per share ex-dividend date: Jul-31-2025
Risk Adjusted Returns v/s
Returns Beta

News

KPT Industries Ltd is Rated Sell by MarketsMOJO
KPT Industries Ltd is rated 'Sell' by MarketsMOJO, with this rating last updated on 10 Nov 2025. However, the analysis and financial metrics discussed here reflect the company’s current position as of 15 June 2026, providing investors with an up-to-date view of the stock’s fundamentals, valuation, financial trends, and technical outlook.
Read full news article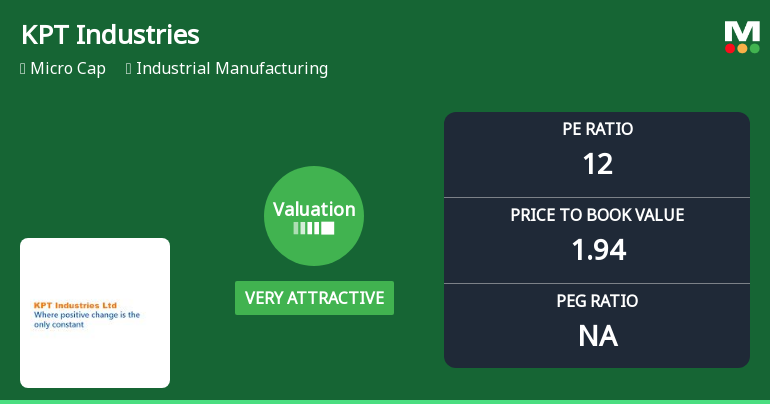
KPT Industries Ltd Valuation Shifts Signal Renewed Price Attractiveness
KPT Industries Ltd has seen a notable shift in its valuation parameters, moving from an attractive to a very attractive grade, despite ongoing market headwinds and a challenging price performance relative to the broader Sensex. This re-rating is driven primarily by improved price-to-earnings and price-to-book value metrics, positioning the micro-cap industrial manufacturing firm as a compelling value proposition within its sector.
Read full news article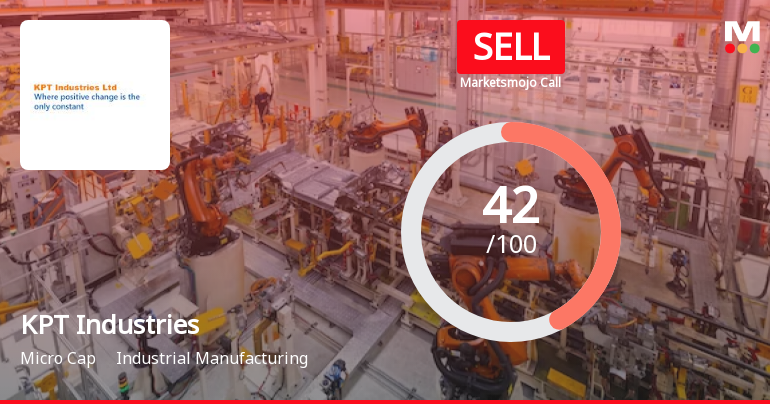
KPT Industries Ltd is Rated Sell by MarketsMOJO
KPT Industries Ltd is rated Sell by MarketsMOJO, with this rating last updated on 10 Nov 2025. However, the analysis and financial metrics discussed here reflect the company’s current position as of 31 May 2026, providing investors with an up-to-date view of the stock’s fundamentals, valuation, financial trend, and technical outlook.
Read full news article Announcements
Compliances-Reg.24(A)-Annual Secretarial Compliance
30-May-2026 | Source : BSEPursuant to Regulation 24A of SEBI (LODR) Regulations 2015 we are enclosing herewith the Secretarial Compliance Report issued by M/s. V. Sreedharan & Associates Practicing Company Secretaries for the year ended on 31st March 2026.
Announcement under Regulation 30 (LODR)-Dividend Updates
29-May-2026 | Source : BSEPursuant to regulation 30 read with Para A of Part A of Schedule III of SEBI (LODR) Regulations 2015 we hereby inform you that the board of directors discussed on the captioned subject and recommended a payment of dividend at the rate of 60% i.e. Rs. 3.00 per share of Rs. 5.00 each for the year ended on 31st March 2026 subject to Members approval at the ensuing Annual General Meeting. The Board meeting commenced at 11:30 a.m. and concluded at 04:30 p.m.
Audited Financial Results For The Quarter Ended On 31St March 2026.
29-May-2026 | Source : BSEPursuant to regulation 33 read with Para A of Part A of Schedule III of the SEBI (LODR) Regulations 2015 we are enclosing herewith Certificate along with statement of Audited Financial Results for the quarter & year ended on 31st March 2026 issued by M/s. P G Bhagwat LLP Chartered Accountants & Statutory Auditors of the Company for your record.
Corporate Actions

No Upcoming Board Meetings

KPT Industries Ltd has declared 60% dividend, ex-date: 31 Jul 25

KPT Industries Ltd has announced 5:10 stock split, ex-date: 14 Feb 08

No Bonus history available

No Rights history available
Quality key factors
Valuation key factors
Technicals key factors
 Technical Indicator Scale: Bearish, Mildly Bearish, Sideways, Mildly Bullish, Bullish Turned
 Shareholding Snapshot : Dec 2025
Shareholding Compare (%holding)
Non Institution
None
Held by 0 Schemes
Held by 0 FIIs
Suvina Engineers Private Limited (22.91%)
Tanvi Jignesh Mehta (4.59%)
44.05%
Quarterly Results Snapshot (Standalone) - Mar'26 - YoY

YoY Growth in quarter ended Mar 2026 is 26.15% vs 1.28% in Mar 2025
YoY Growth in quarter ended Mar 2026 is -5.98% vs -17.53% in Mar 2025
Half Yearly Results Snapshot (Standalone) - Sep'25

Growth in half year ended Sep 2025 is -3.84% vs 14.34% in Sep 2024
Growth in half year ended Sep 2025 is -17.02% vs 43.75% in Sep 2024
Nine Monthly Results Snapshot (Standalone) - Dec'25
YoY Growth in nine months ended Dec 2025 is -2.10% vs 12.37% in Dec 2024
YoY Growth in nine months ended Dec 2025 is -15.22% vs 29.57% in Dec 2024
Annual Results Snapshot (Standalone) - Mar'26
YoY Growth in year ended Mar 2026 is 4.65% vs 9.51% in Mar 2025
YoY Growth in year ended Mar 2026 is -13.35% vs 15.51% in Mar 2025
About KPT Industries Ltd

Company Coordinates


