Krishna Institu.

INR
805.95
0.3 (0.04%)
BSENSE

Jul 08, 03:30 PM

BSE+NSE Vol: 6.87 lacs

  • Price Points
  • Score
  • Mojo Parameters
  • Total Return
  • News and Corporate Actions
  • Key factors
  • Shareholding
  • Financials
  • CompanyCV
stock-summaryPrice Point
High/Low

1Day

52 Week

Valuation
Technical
Day's Volume

CASH

6.87 lacs (8.28%) Volume

Shareholding (Mar 2026)

FII

14.57%

Held by 162 FIIs

DII

32.50%

Held by 55 DIIs

Promoter

34.11%

Why is Krishna Institute of Medical Sciences Ltd falling/rising?

08-Jul-2026

As of 07-Jul, the stock price of Krishna Institute of Medical Sciences Ltd is currently at 805.45, reflecting a decline of 2.2% and a total drop of 5.69% over the last two days. This downward trend indicates a shift in investor sentiment, with the stock underperforming its sector and showing weak trading activity.

As of 07-Jul, the stock price of Krishna Institute of Medical Sciences Ltd is falling, currently at 805.45, which reflects a decrease of 18.15 or 2.2%. This decline is part of a broader trend, as the stock has been losing value for the last two days, resulting in a total drop of 5.69% during this period. Additionally, the stock has underperformed its sector by 2.02% today.<BR><BR>The stock's performance over the past week shows a decline of 1.04%, while the benchmark Sensex has increased by 2.23%. Despite a positive return of 1.99% over the past month, the recent downward movement indicates a shift in investor sentiment. The stock's trading activity also suggests a lack of strong investor participation, with delivery volume falling by 16.66% compared to the five-day average.<BR><BR>Moreover, the stock touched an intraday low of Rs 801.5, indicating a significant drop during the trading session. Although the stock remains above its longer-term moving averages, it is currently below its five-day moving average, which may signal short-term weakness. Overall, these factors contribute to the current decline in the stock price of Krishna Institute of Medical Sciences Ltd.

View full answer

What does Krishna Institu. do?

11-Jun-2026

Krishna Institute of Medical Sciences Ltd is a small-cap company in the hospital industry, incorporated in 1973, with recent quarterly net sales of ₹1,075 Cr and net profit of ₹42 Cr as of March 2026. Key financial metrics include a market cap of ₹31,027 Cr, P/E ratio of 123.00, and a debt-equity ratio of 1.85.

Overview:<BR>Krishna Institute of Medical Sciences Ltd operates in the hospital industry and is categorized as a small-cap company.<BR><BR>History:<BR>The company was incorporated in 1973 as 'Jagjit Singh and Sons Private Limited' and later changed its name to 'Krishna Institute of Medical Sciences Private Limited' in 2004. Following its conversion to a public limited company, it adopted the name 'Krishna Institute of Medical Sciences Limited' on January 29, 2004. The most recent quarterly results reported net sales and net profit for the period ending March 2026.<BR><BR>Financial Snapshot:<BR>- Net Sales: 1,075 Cr (Quarterly Results - Mar 2026)<BR>- Net Profit: 42 Cr (Quarterly Results - Mar 2026)<BR>- Market Cap: INR 31,027 Cr (Small Cap)<BR><BR>Key Metrics:<BR>- P/E: 123.00<BR>- Industry P/E: 60<BR>- Dividend Yield: 0.00%<BR>- Debt-Equity: 1.85<BR>- Return on Equity: 11.03%<BR>- Price to Book: 13.94<BR><BR>Contact Details:<BR>Details: No Company Details Available<BR>Registrar Address: Not available.

View full answer

How big is Krishna Institu.?

11-Jun-2026

As of 10th June, Krishna Institute of Medical Sciences Ltd has a market capitalization of 31,027.00 Cr, with recent Net Sales of 3,904.60 Cr and a Net Profit of 241.40 Cr. Shareholder's Funds were 2,137.80 Cr, and Total Assets amounted to 5,676.10 Cr for the latest annual period ending March 2025.

As of 10th June, Krishna Institute of Medical Sciences Ltd has a market capitalization of 31,027.00 Cr, categorizing it as a Small Cap company.<BR><BR>In the latest four quarters, the company reported Net Sales of 3,904.60 Cr and a Net Profit of 241.40 Cr.<BR><BR>For the latest annual period ending March 2025, the Shareholder's Funds were 2,137.80 Cr, and the Total Assets amounted to 5,676.10 Cr.

View full answer

Who are in the management team of Krishna Institu.?

11-Jun-2026

The management team of Krishna Institu includes Bhaskara Rao Bollineni (Chairman & Managing Director), Abhinay Bollineni (Executive Director & CEO), and several independent directors, bringing diverse expertise to the company.

The management team of Krishna Institu includes the following key members:<BR><BR>1. **Bhaskara Rao Bollineni** - Chairman & Managing Director<BR>2. **Abhinay Bollineni** - Executive Director & CEO<BR>3. **Dandamudi Anitha** - Whole-Time Director & Executive Director<BR>4. **Rajeswara Rao Gandu** - Independent Director<BR>5. **Saumen Chakraborty** - Independent Director<BR>6. **Pankaj Vaish** - Independent Director<BR>7. **Ratna Kishore Kaza** - Independent Director<BR>8. **J V Ramudu** - Independent Director<BR>9. **Y Prameela Rani** - Independent Director<BR>10. **Shantanu Rastogi** - Non-Executive Director<BR>11. **Adwik Bollineni** - Additional Director<BR><BR>This team brings a diverse range of expertise and leadership to the company.

View full answer

Who are the peers of the Krishna Institu.?

11-Jun-2026

Peers of Krishna Institu. include Max Healthcare, Fortis Health, Aster DM Health, Narayana Hrudaya, Global Health, Dr Agarwal's Health, Rainbow Children’s Hospital, and Jupiter Life Line. Krishna Institu. has good management risk and a 1-year return of 15.42%, higher than Max Healthcare but lower than Aster DM Health's 42.08%.

Peers: The peers of Krishna Institu. are Max Healthcare, Fortis Health., Aster DM Health., Narayana Hrudaya, Global Health, Dr Agarwal's Hea, Rainbow Child., Health.Global, Jupiter Life Lin.<BR><BR>Quality Snapshot: Excellent management risk is observed at Max Healthcare and Narayana Hrudaya, while Good management risk is found at Aster DM Health., Global Health, Krishna Institu., Rainbow Child., and Jupiter Life Lin. Average management risk is present at Fortis Health. and Dr Agarwal's Hea. For growth, Excellent growth is noted at Max Healthcare and Narayana Hrudaya, while Good growth is seen at Dr Agarwal's Hea. Below Average growth is reported for Aster DM Health., Global Health, Krishna Institu., Rainbow Child., and Jupiter Life Lin. Excellent capital structure is found at Max Healthcare and Global Health, Good capital structure is present at Fortis Health., Krishna Institu., Dr Agarwal's Hea., Rainbow Child., and Jupiter Life Lin, while Average capital structure is noted at Aster DM Health.<BR><BR>Return Snapshot: Aster DM Health. has the highest 1-year return at 42.08%, while Max Healthcare has the lowest at -14.68%. Krishna Institu.'s 1-year return is 15.42%, which is higher than Max Healthcare but lower than Aster DM Health. Additionally, the peers with negative six-month returns are Max Healthcare, Dr Agarwal's Hea., and Rainbow Child.

View full answer

Should I buy, sell or hold Krishna Institute of Medical Sciences Ltd?

03-Jun-2026

Are Krishna Institute of Medical Sciences Ltd latest results good or bad?

16-May-2026

The latest results for Krishna Institute of Medical Sciences Ltd show strong revenue growth of 34.85% year-on-year, reaching ₹1,074.60 crore in Q4 FY26; however, net profit has plummeted by 58.25%, indicating significant profitability challenges due to rising operational costs and increased interest expenses. Overall, the results reflect underlying issues rather than a positive performance.

The latest results for Krishna Institute of Medical Sciences Ltd (KIMS) indicate a challenging financial situation. While the company achieved record revenues of ₹1,074.60 crore in Q4 FY26, reflecting a year-on-year growth of 34.85% and a sequential increase of 7.71%, the net profit has significantly declined. The consolidated net profit for the quarter was ₹42.50 crore, which represents a staggering 58.25% decrease compared to the same quarter last year and a 20.41% decline from the previous quarter.<BR><BR>Moreover, the operating margin has also taken a hit, contracting to 19.22%, down from 24.85% a year ago. This decline in profitability is attributed to rising operational costs and a substantial increase in interest expenses, which surged by 155% year-on-year.<BR><BR>Overall, while KIMS is experiencing strong revenue growth, the sharp drop in profitability and increasing operational challenges suggest that the latest results are more indicative of underlying issues rather than a positive performance. The company is facing significant hurdles, particularly related to its aggressive expansion strategy, which has not yet translated into sustainable profitability.

View full answer

When is the next results date for Krishna Institute of Medical Sciences Ltd?

07-May-2026

The next results date for Krishna Institute of Medical Sciences Ltd is 15 May 2026.

The next results date for Krishna Institute of Medical Sciences Ltd is scheduled for 15 May 2026.

View full answer

Is Krishna Institu. technically bullish or bearish?

02-Dec-2025

As of December 1, 2025, the trend is mildly bullish due to daily moving averages, but caution is advised as weekly MACD and KST are bearish, despite a bullish weekly RSI and mixed signals from Bollinger Bands.

As of 1 December 2025, the technical trend has changed from sideways to mildly bullish. The current stance is mildly bullish, driven by the daily moving averages indicating bullish momentum. However, the weekly MACD and KST are both mildly bearish, which suggests some caution. The weekly RSI is bullish, supporting the positive outlook, while the Bollinger Bands show a mixed signal with a bullish monthly perspective. Overall, the strength of the bullish sentiment is tempered by the bearish signals in the weekly indicators.

View full answer

Is Krishna Institu. overvalued or undervalued?

27-Nov-2025

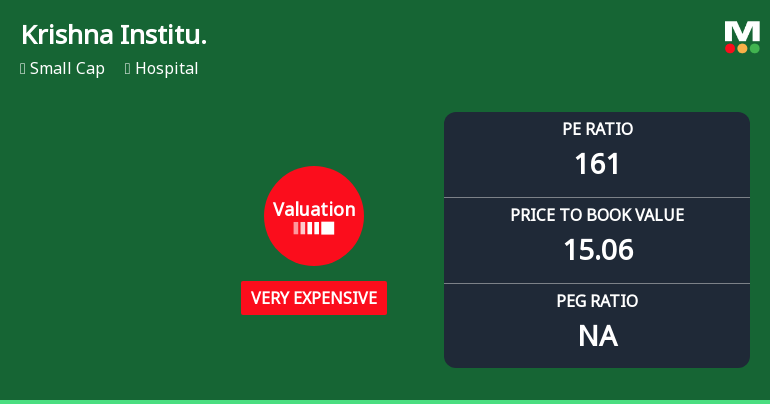
As of November 26, 2025, Krishna Institute is considered very expensive with a PE ratio of 83.68, significantly higher than peers like Apollo Hospitals and Max Healthcare, indicating it is overvalued despite a 14.51% return over the past year compared to the Sensex's 7.01%.

As of 26 November 2025, the valuation grade for Krishna Institute has moved from expensive to very expensive. This indicates that the company is currently overvalued. Key ratios highlight this situation, with a PE ratio of 83.68, an EV to EBITDA of 38.97, and a Price to Book Value of 12.07. <BR><BR>In comparison to peers, Krishna Institute's valuation is notably higher than that of Apollo Hospitals, which has a PE ratio of 63.6 and an EV to EBITDA of 33.45, indicating that Krishna is trading at a significant premium. Additionally, Max Healthcare, another peer, has a PE ratio of 80.02, further emphasizing the elevated valuation of Krishna Institute. While the company has outperformed the Sensex over the past year with a return of 14.51% compared to the Sensex's 7.01%, the current valuation suggests caution for potential investors.

View full answer

How has been the historical performance of Krishna Institu.?

24-Nov-2025

Krishna Institu has demonstrated consistent growth from March 2020 to March 2025, with net sales increasing from INR 1,122.65 crore to INR 3,035.00 crore, and profit after tax rising from INR 115.07 crore to INR 414.50 crore. The company's total assets and cash flow from operating activities also significantly improved during this period.

Answer:<BR>The historical performance of Krishna Institu shows a consistent growth trajectory in net sales and profitability over the years.<BR><BR>Breakdown:<BR>Krishna Institu's net sales have increased significantly from INR 1,122.65 crore in March 2020 to INR 3,035.00 crore in March 2025, demonstrating a strong upward trend. The total operating income followed a similar pattern, reaching INR 3,035.00 crore in March 2025, up from INR 1,122.65 crore in March 2020. The company's operating profit (PBDIT) also saw substantial growth, rising from INR 251.08 crore in March 2020 to INR 814.60 crore in March 2025. Profit before tax increased from INR 140.53 crore in March 2020 to INR 557.90 crore in March 2025, while profit after tax rose from INR 115.07 crore to INR 414.50 crore in the same period. The company's total assets grew from INR 1,194.47 crore in March 2020 to INR 5,676.10 crore in March 2025, indicating a robust expansion in its asset base. Total liabilities also increased, from INR 1,194.47 crore to INR 5,676.10 crore, reflecting the company's growing financial commitments. Cash flow from operating activities improved from INR 201.00 crore in March 2020 to INR 581.00 crore in March 2025, while net cash inflow turned positive at INR 9.00 crore in March 2025, compared to a net outflow in previous years. Overall, Krishna Institu has shown strong growth in sales, profits, and asset accumulation over the past five years.

View full answer

Who are the top shareholders of the Krishna Institu.?

17-Jul-2025

The top shareholders of Krishna Institu include promoter Bhaskara Rao Bollineni with 26.27%, mutual funds at 25.35%, foreign institutional investors at 15.45%, and the SBI Small Cap Fund as the largest public shareholder with 6.31%. Individual investors collectively hold 11.24% of the shares.

The top shareholders of Krishna Institu include the promoters, who hold a majority stake in the company. The promoter with the highest holding is Bhaskara Rao Bollineni, with a significant 26.27%. Additionally, mutual funds hold 25.35% of the shares through 24 different schemes, while foreign institutional investors (FIIs) account for 15.45% with 171 FIIs involved. The highest public shareholder is the SBI Small Cap Fund, which holds 6.31%. Individual investors collectively hold 11.24% of the shares.

View full answer

Has Krishna Institu. declared dividend?

06-Jun-2025

No Dividend History Available

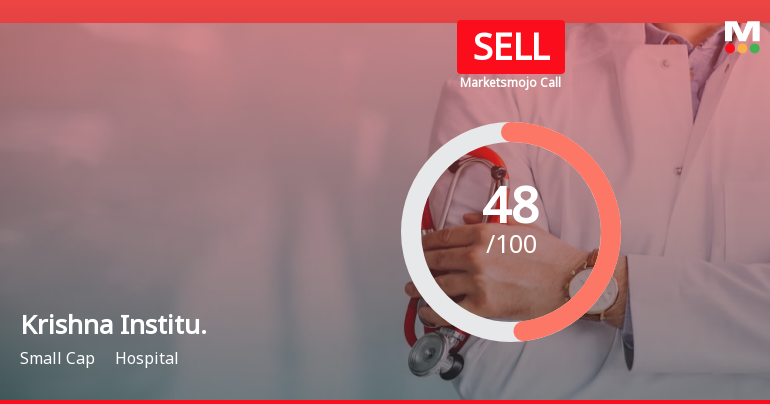
iScoreScore
Click here to find our call on this stock
Strong Sell
Sell
Hold
Buy
Strong Buy

Dashboard

1

High Management Efficiency with a high ROCE of 17.88%

 
2

Company's ability to service its debt is strong with a healthy EBIT to Interest (avg) ratio of 12.59

 
3

Poor long term growth as Operating profit has grown by an annual rate 11.48% of over the last 5 years

 
4

The company has declared negative results for the last 4 consecutive quarters

5

With ROCE of 8.1, it has a Very Expensive valuation with a 5.9 Enterprise value to Capital Employed

6

High Institutional Holdings at 47.07%

7

Market Beating performance in long term as well as near term

stock-summaryMojo Parameters

Mojo Parameters

Loading Valuation Snapshot...

Stock DNA

stock-summary
Industry

Hospital

stock-summary
Market cap

INR 33,811 Cr (Small Cap)

stock-summary
P/E

137.00

stock-summary
Industry P/E

63

stock-summary
Dividend Yield

0.00%

stock-summary
Debt Equity

1.85

stock-summary
Return on Equity

11.03%

stock-summary
Price to Book

14.99

Revenue and Profits:
Net Sales:
1,075 Cr
(Quarterly Results - Mar 2026)
Net Profit:
42 Cr
stock-summaryTotal Returns
Total Returns (Price + Dividend) stock-summary
Dividend Yield (0%)
TimePeriod
Price Return
Dividend Return
Total Return
3 Months
21.32%
0%
21.32%
6 Months
32.31%
0%
32.31%
1 Year
14.92%
0%
14.92%
2 Years
92.04%
0%
92.04%
3 Years
125.31%
0%
125.31%
4 Years
234.42%
0%
234.42%
5 Years
257.14%
0%
257.14%

Krishna Institu. for the last several years.

Risk Adjusted Returns v/s stock-summary
Returns Beta
Icon
Beta has not been calculated since enough price history is not available
stock-summaryKey Factors

Quality key factors stock-summary

Factor
Value
Sales Growth (5y)
24.04%
EBIT Growth (5y)
11.48%
EBIT to Interest (avg)
12.59
Debt to EBITDA (avg)
2.15
Net Debt to Equity (avg)
1.85
Sales to Capital Employed (avg)
0.83
Tax Ratio
27.50%
Dividend Payout Ratio
0
Pledged Shares
10.26%
Institutional Holding
47.07%
ROCE (avg)
20.10%
ROE (avg)
17.81%

Valuation key factors

Factor
Value
P/E Ratio
137
Industry P/E
63
Price to Book Value
15.12
EV to EBIT
73.52
EV to EBITDA
47.56
EV to Capital Employed
5.95
EV to Sales
9.77
PEG Ratio
NA
Dividend Yield
NA
ROCE (Latest)
8.09%
ROE (Latest)
11.03%

Technicals key factors

Indicator
Weekly
Monthly
MACD
Bullish
Mildly Bearish
RSI
No Signal
No Signal
Bollinger Bands
Mildly Bullish
Mildly Bullish
Moving Averages
Bullish (Daily)
KST
Bullish
Mildly Bearish
Dow Theory
Bullish
Bullish
OBV
No Trend
Bullish
stock-summary Technical Indicator Scale: Bearish, Mildly Bearish, Sideways, Mildly Bullish, Bullish  Turned 
stock-summaryShareholding
Shareholding Snapshot : Mar 2026stock-summary
Shareholding Compare (%holding) stock-summary
Majority shareholders

Promoters

Pledged Promoter Holdings

10.2572

Mutual Funds

Held by 30 Schemes (27.41%)

FIIs

Held by 162 FIIs (14.57%)

Promoter with highest holding

Bhaskara Rao Bollineni (26.27%)

Highest Public shareholder

Sbi Small Cap Fund (5.89%)

Individual Investors Holdings

11.84%

stock-summaryFinancial
[
  {
    "link": "quarterly",
    "btn_text": "All Quarterly Results",
    "header": "Quarterly Results Snapshot (Consolidated) - Mar'26 - QoQ",
    "rhs": [
      {
        "prefix": "Net Sales ",
        "suffix": "QoQ Growth in quarter ended Mar 2026 is 7.71% vs 3.85% in Dec 2025",
        "dir": 1
      },
      {
        "prefix": "Consolidated Net Profit ",
        "suffix": "QoQ Growth in quarter ended Mar 2026 is -20.41% vs -20.18% in Dec 2025",
        "dir": -1
      }
    ],
    "table": {
      "header": [
        "Mar'26",
        "Dec'25",
        "Change(%)"
      ],
      "body": [
        {
          "field": "Net Sales",
          "val1": "1,074.60",
          "val2": "997.70",
          "chgp": "7.71%",
          "chgp_class": "positive"
        },
        {
          "field": "Operating Profit (PBDIT) excl Other Income",
          "val1": "206.50",
          "val2": "198.90",
          "chgp": "3.82%",
          "chgp_class": "positive"
        },
        {
          "field": "Interest",
          "val1": "68.10",
          "val2": "56.80",
          "chgp": "19.89%",
          "chgp_class": "negative"
        },
        {
          "field": "Exceptional Items",
          "val1": "-10.90",
          "val2": "0.00",
          "chgp": "",
          "chgp_class": "neutral"
        },
        {
          "field": "Consolidate Net Profit",
          "val1": "42.50",
          "val2": "53.40",
          "chgp": "-20.41%",
          "chgp_class": "negative"
        },
        {
          "field": "Operating Profit Margin (Excl OI)",
          "val1": "19.22%",
          "val2": "19.94%",
          "chgp": "-0.72%",
          "chgp_class": "negative"
        }
      ]
    }
  },
  {
    "link": "half-yearly",
    "btn_text": "All Half Yearly Results",
    "header": "Half Yearly Results Snapshot (Consolidated) - Sep'25",
    "rhs": [
      {
        "prefix": "Net Sales ",
        "suffix": " Growth in half year ended Sep 2025 is 25.01% vs 16.46% in Sep 2024",
        "dir": 1
      },
      {
        "prefix": "Consolidated Net Profit ",
        "suffix": " Growth in half year ended Sep 2025 is -25.00% vs 12.25% in Sep 2024",
        "dir": -1
      }
    ],
    "table": {
      "header": [
        "Sep'25",
        "Sep'24",
        "Change(%)"
      ],
      "body": [
        {
          "field": "Net Sales",
          "val1": "1,832.30",
          "val2": "1,465.70",
          "chgp": "25.01%",
          "chgp_class": "positive"
        },
        {
          "field": "Operating Profit (PBDIT) excl Other Income",
          "val1": "396.60",
          "val2": "397.50",
          "chgp": "-0.23%",
          "chgp_class": "negative"
        },
        {
          "field": "Interest",
          "val1": "77.60",
          "val2": "37.80",
          "chgp": "105.29%",
          "chgp_class": "negative"
        },
        {
          "field": "Exceptional Items",
          "val1": "0.00",
          "val2": "0.00",
          "chgp": "",
          "chgp_class": "neutral"
        },
        {
          "field": "Consolidate Net Profit",
          "val1": "145.50",
          "val2": "194.00",
          "chgp": "-25.00%",
          "chgp_class": "negative"
        },
        {
          "field": "Operating Profit Margin (Excl OI)",
          "val1": "21.64%",
          "val2": "27.12%",
          "chgp": "-5.48%",
          "chgp_class": "negative"
        }
      ]
    }
  },
  {
    "link": "nine-monthly",
    "btn_text": "All Nine Monthly Results",
    "header": "Nine Monthly Results Snapshot (Consolidated) - Dec'25",
    "rhs": [
      {
        "prefix": "Net Sales ",
        "suffix": "YoY Growth in nine months ended Dec 2025 is 26.45% vs 20.05% in Dec 2024",
        "dir": 1
      },
      {
        "prefix": "Consolidated Net Profit ",
        "suffix": "YoY Growth in nine months ended Dec 2025 is -29.64% vs 15.54% in Dec 2024",
        "dir": -1
      }
    ],
    "table": {
      "header": [
        "Dec'25",
        "Dec'24",
        "Change(%)"
      ],
      "body": [
        {
          "field": "Net Sales",
          "val1": "2,830.00",
          "val2": "2,238.10",
          "chgp": "26.45%",
          "chgp_class": "positive"
        },
        {
          "field": "Operating Profit (PBDIT) excl Other Income",
          "val1": "595.50",
          "val2": "584.70",
          "chgp": "1.85%",
          "chgp_class": "positive"
        },
        {
          "field": "Interest",
          "val1": "134.40",
          "val2": "63.50",
          "chgp": "111.65%",
          "chgp_class": "negative"
        },
        {
          "field": "Exceptional Items",
          "val1": "0.00",
          "val2": "0.00",
          "chgp": "",
          "chgp_class": "neutral"
        },
        {
          "field": "Consolidate Net Profit",
          "val1": "198.90",
          "val2": "282.70",
          "chgp": "-29.64%",
          "chgp_class": "negative"
        },
        {
          "field": "Operating Profit Margin (Excl OI)",
          "val1": "21.04%",
          "val2": "26.12%",
          "chgp": "-5.08%",
          "chgp_class": "negative"
        }
      ]
    }
  },
  {
    "link": "annual",
    "btn_text": "All Annual Results",
    "header": "Annual Results Snapshot (Consolidated) - Mar'26",
    "rhs": [
      {
        "prefix": "Net Sales ",
        "suffix": "YoY Growth in year ended Mar 2026 is 28.65% vs 21.49% in Mar 2025",
        "dir": 1
      },
      {
        "prefix": "Consolidated Net Profit ",
        "suffix": "YoY Growth in year ended Mar 2026 is -37.22% vs 24.03% in Mar 2025",
        "dir": -1
      }
    ],
    "table": {
      "header": [
        "Mar'26",
        "Mar'25",
        "Change(%)"
      ],
      "body": [
        {
          "field": "Net Sales",
          "val1": "3,904.60",
          "val2": "3,035.00",
          "chgp": "28.65%",
          "chgp_class": "positive"
        },
        {
          "field": "Operating Profit (PBDIT) excl Other Income",
          "val1": "802.00",
          "val2": "782.70",
          "chgp": "2.47%",
          "chgp_class": "positive"
        },
        {
          "field": "Interest",
          "val1": "202.50",
          "val2": "90.20",
          "chgp": "124.50%",
          "chgp_class": "negative"
        },
        {
          "field": "Exceptional Items",
          "val1": "-11.20",
          "val2": "10.80",
          "chgp": "-203.70%",
          "chgp_class": "negative"
        },
        {
          "field": "Consolidate Net Profit",
          "val1": "241.40",
          "val2": "384.50",
          "chgp": "-37.22%",
          "chgp_class": "negative"
        },
        {
          "field": "Operating Profit Margin (Excl OI)",
          "val1": "20.54%",
          "val2": "25.79%",
          "chgp": "-5.25%",
          "chgp_class": "negative"
        }
      ]
    }
  }
]

Quarterly Results Snapshot (Consolidated) - Mar'26 - QoQstock-summary

Mar'26
Dec'25
Change(%)
Net Sales
1,074.60
997.70
7.71%
Operating Profit (PBDIT) excl Other Income
206.50
198.90
3.82%
Interest
68.10
56.80
19.89%
Exceptional Items
-10.90
0.00
Consolidate Net Profit
42.50
53.40
-20.41%
Operating Profit Margin (Excl OI)
19.22%
19.94%
-0.72%
Values in Rs Cr.
Direction Arrows
Net Sales

QoQ Growth in quarter ended Mar 2026 is 7.71% vs 3.85% in Dec 2025

Direction Arrows
Consolidated Net Profit

QoQ Growth in quarter ended Mar 2026 is -20.41% vs -20.18% in Dec 2025

Half Yearly Results Snapshot (Consolidated) - Sep'25stock-summary

Sep'25
Sep'24
Change(%)
Net Sales
1,832.30
1,465.70
25.01%
Operating Profit (PBDIT) excl Other Income
396.60
397.50
-0.23%
Interest
77.60
37.80
105.29%
Exceptional Items
0.00
0.00
Consolidate Net Profit
145.50
194.00
-25.00%
Operating Profit Margin (Excl OI)
21.64%
27.12%
-5.48%
Values in Rs Cr.
Direction Arrows
Net Sales

Growth in half year ended Sep 2025 is 25.01% vs 16.46% in Sep 2024

Direction Arrows
Consolidated Net Profit

Growth in half year ended Sep 2025 is -25.00% vs 12.25% in Sep 2024

Nine Monthly Results Snapshot (Consolidated) - Dec'25stock-summary

Dec'25
Dec'24
Change(%)
Net Sales
2,830.00
2,238.10
26.45%
Operating Profit (PBDIT) excl Other Income
595.50
584.70
1.85%
Interest
134.40
63.50
111.65%
Exceptional Items
0.00
0.00
Consolidate Net Profit
198.90
282.70
-29.64%
Operating Profit Margin (Excl OI)
21.04%
26.12%
-5.08%
Values in Rs Cr.
Direction Arrows
Net Sales

YoY Growth in nine months ended Dec 2025 is 26.45% vs 20.05% in Dec 2024

Direction Arrows
Consolidated Net Profit

YoY Growth in nine months ended Dec 2025 is -29.64% vs 15.54% in Dec 2024

Annual Results Snapshot (Consolidated) - Mar'26stock-summary

Mar'26
Mar'25
Change(%)
Net Sales
3,904.60
3,035.00
28.65%
Operating Profit (PBDIT) excl Other Income
802.00
782.70
2.47%
Interest
202.50
90.20
124.50%
Exceptional Items
-11.20
10.80
-203.70%
Consolidate Net Profit
241.40
384.50
-37.22%
Operating Profit Margin (Excl OI)
20.54%
25.79%
-5.25%
Values in Rs Cr.
Direction Arrows
Net Sales

YoY Growth in year ended Mar 2026 is 28.65% vs 21.49% in Mar 2025

Direction Arrows
Consolidated Net Profit

YoY Growth in year ended Mar 2026 is -37.22% vs 24.03% in Mar 2025

stock-summaryCompany CV
About Krishna Institute of Medical Sciences Ltd stock-summary
stock-summary
Krishna Institute of Medical Sciences Ltd
Small Cap
Hospital
Krishna Institute of Medical Sciences Limited (KIMS) was erstwhile incorporated as `Jagjit Singh and Sons Private Limited', a Private Limited Company on July 26, 1973 in Mumbai. Subsequently, the name of the Company changed to `Krishna Institute of Medical Sciences Private Limited' on January 2, 2004 and further upon its conversion to a Public Limited Company, the name was changed to `Krishna Institute of Medical Sciences Limited' on January 29, 2004.
Company Coordinates stock-summary
Icon
No Company Details Available