
Compare Kriti Nutrients with Similar Stocks
Dashboard
High Management Efficiency with a high ROE of 16.66%
Company has a Debt to Equity ratio (avg) of 0.06 times
Poor long term growth as Net Sales has grown by an annual rate of 5.96% and Operating profit at 14.96% over the last 5 years
Flat results in Mar 26
With ROE of 14.8, it has a Attractive valuation with a 2 Price to Book Value
Majority shareholders : Promoters
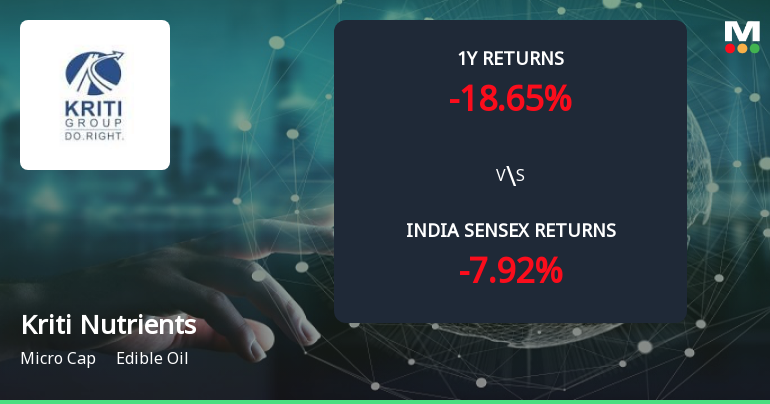
Underperformed the market in the last 1 year
Total Returns (Price + Dividend) 
Latest dividend: 3 per share ex-dividend date: Nov-13-2025
Risk Adjusted Returns v/s
Returns Beta

News
Kriti Nutrients Ltd Forms Golden Cross Amid Mixed Technical Signals and Micro-Cap Challenges
The 50-day moving average for Kriti Nutrients Ltd has crossed above the 200-day moving average, signalling a golden cross on 3 Jun 2026. Yet, this technical milestone arrives amid a complex backdrop: weekly indicators lean bullish while monthly momentum remains bearish, and the stock’s micro-cap status raises questions about signal reliability.
Read full news article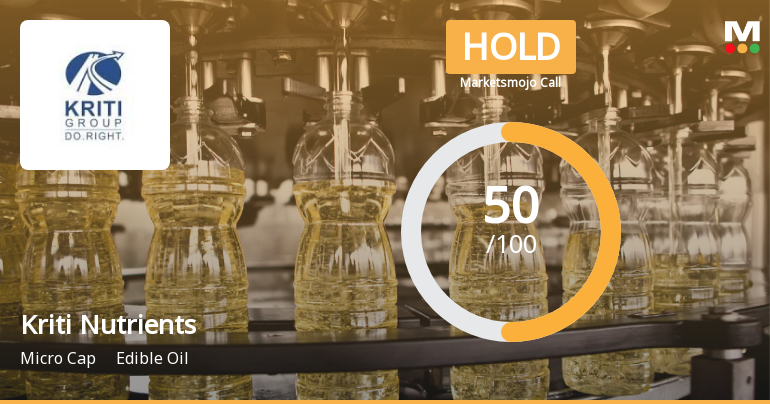
Kriti Nutrients Ltd Upgraded to Hold on Improved Valuation and Financial Metrics
Kriti Nutrients Ltd, a micro-cap player in the edible oil sector, has seen its investment rating upgraded from Sell to Hold as of 1 June 2026. This change reflects an improved valuation outlook alongside stable financial trends and solid management efficiency, despite recent flat quarterly performance and a challenging market environment.
Read full news article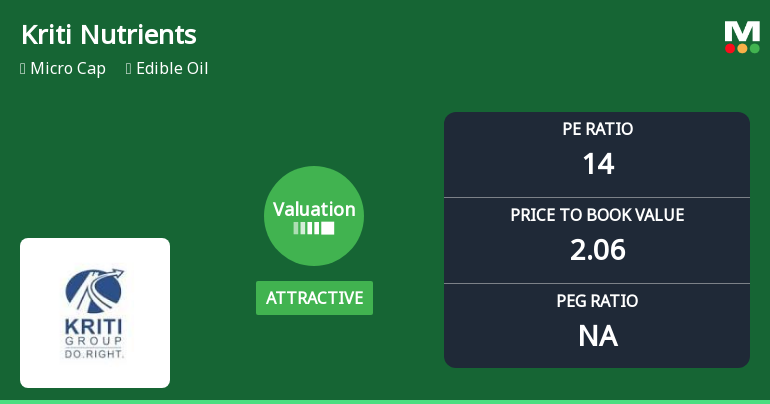
Kriti Nutrients Ltd Valuation Shifts Signal Renewed Price Attractiveness
Kriti Nutrients Ltd has witnessed a notable shift in its valuation parameters, moving from a fair to an attractive rating, signalling a potential buying opportunity for investors within the edible oil sector. This change comes amid a backdrop of mixed market returns and evolving sector fundamentals, prompting a reassessment of the company’s price-to-earnings and price-to-book value metrics relative to its peers and historical averages.
Read full news article Announcements
Format of the Initial Disclosure to be made by an entity identified as a Large Corporate : Annexure A
09-May-2026 | Source : BSEFormat of Initial Disclosure to be made by an entity identified as a Large Corporate.
| Sr. No. | Particulars | Details |
| 1 | Name of Company | Kriti Nutrients Ltd |
| 2 | CIN NO. | L24132MP1996PLC011245 |
| 3 | Outstanding borrowing of company as on 31st March / 31st December as applicable (in Rs cr) | 0.00 |
| 4 | Highest Credit Rating during the previous FY | A- |
| 4a | Name of the Credit Rating Agency issuing the Credit Rating mentioned in (4) | CARE RATINGS LIMITED |
| 5 | Name of Stock Exchange# in which the fine shall be paid in case of shortfall in the required borrowing under the framework | BSE |
Designation: COMPANY SECRETARY
EmailId: cs@kritiindia.com
Designation: CHIEF FINANCIAL OFFICER
EmailId: mohangehlot@kritiindia.com
Date: 09/05/2026
Note: In terms para of 3.2(ii) of the circular beginning F.Y 2022 in the event of shortfall in the mandatory borrowing through debt securities a fine of 0.2% of the shortfall shall be levied by Stock Exchanges at the end of the two-year block period. Therefore an entity identified as LC shall provide in its initial disclosure for a financial year the name of Stock Exchange to which it would pay the fine in case of shortfall in the mandatory borrowing through debt markets.
Announcement under Regulation 30 (LODR)-Newspaper Publication
07-May-2026 | Source : BSENewspaper Publication for Audited Standalone & Consolidated Financial Results for Quarter ended 31st March2026.
Announcement under Regulation 30 (LODR)-Dividend Updates
05-May-2026 | Source : BSEThe board of director have not recommended any final dividend for the FY 2025-26.
Corporate Actions

No Upcoming Board Meetings

Kriti Nutrients Ltd has declared 300% dividend, ex-date: 13 Nov 25

No Splits history available

No Bonus history available

No Rights history available
Quality key factors
Valuation key factors
Technicals key factors
 Technical Indicator Scale: Bearish, Mildly Bearish, Sideways, Mildly Bullish, Bullish Turned
 Shareholding Snapshot : Mar 2026
Shareholding Compare (%holding)
Promoters
None
Held by 0 Schemes
Held by 0 FIIs
Sakam Trading Private Limited (61.72%)
Chartered Finance & Leasing Limited (5.05%)
19.36%
Quarterly Results Snapshot (Consolidated) - Mar'26 - QoQ

QoQ Growth in quarter ended Mar 2026 is 13.78% vs 5.34% in Dec 2025

QoQ Growth in quarter ended Mar 2026 is -30.57% vs 2.92% in Dec 2025
Half Yearly Results Snapshot (Standalone) - Sep'25
Growth in half year ended Sep 2025 is 22.31% vs 4.65% in Sep 2024
Growth in half year ended Sep 2025 is -22.62% vs 6.67% in Sep 2024
Nine Monthly Results Snapshot (Standalone) - Dec'25
YoY Growth in nine months ended Dec 2025 is 24.71% vs 4.33% in Dec 2024
YoY Growth in nine months ended Dec 2025 is -13.81% vs -12.18% in Dec 2024
Annual Results Snapshot (Consolidated) - Mar'26
YoY Growth in year ended Mar 2026 is 25.49% vs 7.30% in Mar 2025
YoY Growth in year ended Mar 2026 is -8.35% vs -18.33% in Mar 2025
About Kriti Nutrients Ltd

Company Coordinates


