
Compare Kritika Wires with Similar Stocks
Dashboard
Weak Long Term Fundamental Strength with an average Return on Capital Employed (ROCE) of 6.84%
- Poor long term growth as Operating profit has grown by an annual rate 15.91% of over the last 5 years
- Low ability to service debt as the company has a high Debt to EBITDA ratio of 3.94 times
Negative results in Mar 26
Below par performance in long term as well as near term
Stock DNA
Iron & Steel Products
INR 159 Cr (Micro Cap)
21.00
26
0.00%
0.46
7.56%
1.58
Total Returns (Price + Dividend) 
Latest dividend: 0.032999999999999995 per share ex-dividend date: Jul-21-2022
Risk Adjusted Returns v/s
Returns Beta

News
Kritika Wires Ltd is Rated Strong Sell
Kritika Wires Ltd is rated Strong Sell by MarketsMOJO, with this rating last updated on 07 July 2025. However, the analysis and financial metrics discussed here reflect the stock's current position as of 12 June 2026, providing investors with an up-to-date view of the company’s performance and outlook.
Read full news article
Kritika Wires Ltd is Rated Strong Sell
Kritika Wires Ltd is rated Strong Sell by MarketsMOJO, with this rating last updated on 07 Jul 2025. However, the analysis and financial metrics discussed here reflect the stock’s current position as of 31 May 2026, providing investors with an up-to-date view of its performance and outlook.
Read full news article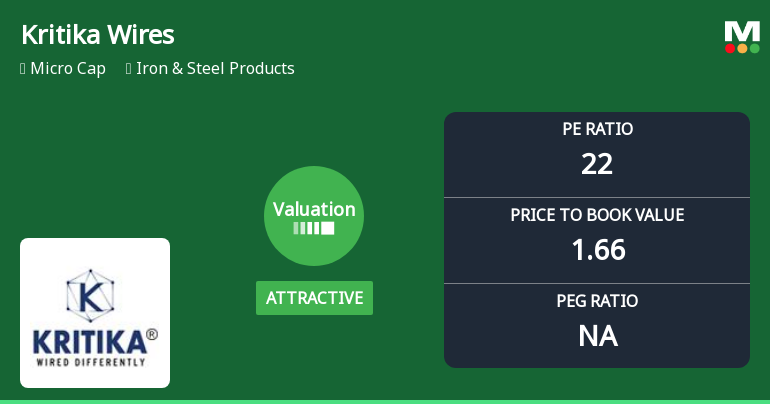
Kritika Wires Ltd Valuation Shifts Signal Changing Market Sentiment
Kritika Wires Ltd, a micro-cap player in the Iron & Steel Products sector, has witnessed a notable shift in its valuation parameters, moving from a very attractive to an attractive rating. Despite a challenging market backdrop and a Strong Sell mojo grade, the company’s price-to-earnings (P/E) and price-to-book value (P/BV) ratios suggest a nuanced change in investor perception, warranting a closer examination of its price attractiveness relative to peers and historical benchmarks.
Read full news article Announcements
Kritika Wires Limited - Outcome of Board Meeting
15-Nov-2019 | Source : NSEKritika Wires Limited has informed the Exchange regarding Board meeting held on November 14, 2019.
Kritika Wires Limited - Statement of deviation(s) or variation(s) under Reg. 32
22-Oct-2019 | Source : NSEKritika Wires Limited has informed the Exchange regarding Statement of deviation(s) or variation(s) under Reg. 32 of SEBI (LODR) Regulations 2015
Kritika Wires Limited - Updates
18-Oct-2019 | Source : NSEKritika Wires Limited has informed the Exchange regarding 'Certificate under Regulation 74(5) of SEBI (Depositories and Participants) Regulations, 2018'.
Corporate Actions

No Upcoming Board Meetings

Kritika Wires Ltd has declared 5% dividend, ex-date: 21 Jul 22

Kritika Wires Ltd has announced 2:10 stock split, ex-date: 30 Aug 22

Kritika Wires Ltd has announced 2:1 bonus issue, ex-date: 19 Dec 23

No Rights history available
Quality key factors
Valuation key factors
Technicals key factors
 Technical Indicator Scale: Bearish, Mildly Bearish, Sideways, Mildly Bullish, Bullish Turned
 Shareholding Snapshot : Mar 2026
Shareholding Compare (%holding)
Promoters
None
Held by 0 Schemes
Held by 0 FIIs
Gunnayak Commercial Private Limited (16.32%)
None
29.7%
Quarterly Results Snapshot (Standalone) - Mar'26 - QoQ

QoQ Growth in quarter ended Mar 2026 is -8.96% vs -10.30% in Dec 2025

QoQ Growth in quarter ended Mar 2026 is 25.77% vs 42.98% in Dec 2025
Half Yearly Results Snapshot (Standalone) - Sep'25
Growth in half year ended Sep 2025 is 18.23% vs 58.74% in Sep 2024
Growth in half year ended Sep 2025 is -45.67% vs 33.53% in Sep 2024
Nine Monthly Results Snapshot (Standalone) - Dec'25
YoY Growth in nine months ended Dec 2025 is 8.26% vs 69.58% in Dec 2024
YoY Growth in nine months ended Dec 2025 is -38.58% vs 26.22% in Dec 2024
Annual Results Snapshot (Standalone) - Mar'26
YoY Growth in year ended Mar 2026 is -6.80% vs 72.55% in Mar 2025
YoY Growth in year ended Mar 2026 is -38.89% vs -2.60% in Mar 2025
About Kritika Wires Ltd

Company Coordinates


