
Compare Sh. Bajrang All. with Similar Stocks
Dashboard
Weak Long Term Fundamental Strength with a -42.60% CAGR growth in Operating Profits over the last 5 years
- Company's ability to service its debt is weak with a poor EBIT to Interest (avg) ratio of 1.69
- The company has been able to generate a Return on Capital Employed (avg) of 1.12% signifying low profitability per unit of total capital (equity and debt)
Flat results in Mar 26
Stock DNA
Iron & Steel Products
INR 185 Cr (Micro Cap)
4.00
26
0.00%
0.27
11.54%
0.47
Total Returns (Price + Dividend) 

Risk Adjusted Returns v/s
Returns Beta
News
Are Shri Bajrang Alliance Ltd latest results good or bad?
Shri Bajrang Alliance Ltd's latest financial results for Q4 FY26 present a complex picture of performance. The consolidated net profit reached ₹19.40 crores, reflecting a significant growth compared to the previous quarter and the same quarter last year. This growth is primarily attributed to a substantial increase in other income, which raised concerns about the sustainability of earnings, as operational performance alone would have resulted in losses. In contrast, the standalone revenue for the quarter was ₹47.29 crores, marking a notable decline of 41.20% year-on-year, although there was a slight sequential improvement of 0.70%. This decline indicates ongoing challenges in the company's core structural steel business, which is struggling to maintain market share in a competitive sector. The operating margin, excluding other income, improved to 1.61% from a negative margin in the previous quarter, sugges...
Read full news article
Shri Bajrang Alliance Q4 FY26: Consolidated Profit Surges 214% Despite Revenue Decline
Shri Bajrang Alliance Ltd., a Raipur-based structural steel manufacturer, delivered a puzzling fourth quarter performance for FY26, with consolidated net profit surging 214.42% quarter-on-quarter to ₹19.40 crores even as standalone revenue declined sharply. The micro-cap company, trading at ₹174.00 with a market capitalisation of ₹152.00 crores, saw its stock rally 5.17% on June 01, 2026, following the results announcement. However, the quarter revealed significant operational challenges masked by exceptional non-operating income.
Read full news article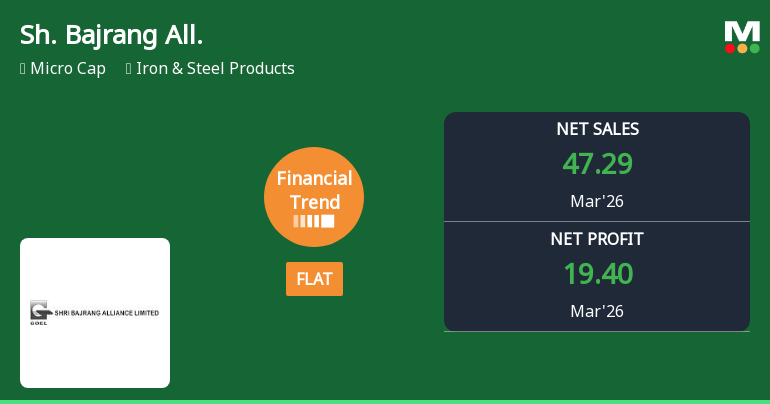
Shri Bajrang Alliance Ltd Reports Flat Quarterly Performance Amid Mixed Financial Trends
Shri Bajrang Alliance Ltd reported a flat financial performance for the quarter ended March 2026, marking a notable improvement from previous negative trends. Despite a sharp decline in net sales, the company achieved its highest quarterly PAT and EPS, signalling a complex interplay of operational challenges and profitability gains within the iron and steel products sector.
Read full news article Announcements
Corporate Actions

No Upcoming Board Meetings

Shri Bajrang Alliance Ltd has declared 10% dividend, ex-date: 19 Sep 08

No Splits history available

Shri Bajrang Alliance Ltd has announced 2:1 bonus issue, ex-date: 01 Feb 07

No Rights history available
Quality key factors
Valuation key factors
Technicals key factors
 Technical Indicator Scale: Bearish, Mildly Bearish, Sideways, Mildly Bullish, Bullish Turned
 Shareholding Snapshot : Mar 2026
Shareholding Compare (%holding)
Promoters
None
Held by 0 Schemes
Held by 0 FIIs
Rajendra Goel And Sons (9.42%)
Atlanta Securities Pvt Ltd (8.41%)
22.48%
Quarterly Results Snapshot (Consolidated) - Mar'26 - QoQ

QoQ Growth in quarter ended Mar 2026 is 0.70% vs -46.27% in Dec 2025
QoQ Growth in quarter ended Mar 2026 is 214.42% vs -38.97% in Dec 2025
Half Yearly Results Snapshot (Consolidated) - Sep'25

Growth in half year ended Sep 2025 is -16.12% vs -3.88% in Sep 2024
Growth in half year ended Sep 2025 is 29.18% vs -25.58% in Sep 2024
Nine Monthly Results Snapshot (Consolidated) - Dec'25
YoY Growth in nine months ended Dec 2025 is -29.64% vs -7.41% in Dec 2024
YoY Growth in nine months ended Dec 2025 is 16.83% vs -20.60% in Dec 2024
Annual Results Snapshot (Consolidated) - Mar'26
YoY Growth in year ended Mar 2026 is -31.98% vs -30.10% in Mar 2025
YoY Growth in year ended Mar 2026 is 35.80% vs -20.22% in Mar 2025
About Shri Bajrang Alliance Ltd

Company Coordinates


