
Compare KRN Heat Exchan with Similar Stocks
Dashboard
Strong ability to service debt as the company has a low Debt to EBITDA ratio of 1.07 times
Healthy long term growth as Net Sales has grown by an annual rate of 39.80%
With a growth in Net Sales of 17.13%, the company declared Very Positive results in Mar 26
Increasing Participation by Institutional Investors
Market Beating Performance
Stock DNA
Other Industrial Products
INR 8,339 Cr (Small Cap)
105.00
37
0.00%
0.25
13.32%
13.99
Total Returns (Price + Dividend) 
KRN Heat Exchan for the last several years.
Risk Adjusted Returns v/s
Returns Beta

News

KRN Heat Exchanger and Refrigeration Ltd Locks at Upper Circuit With 5% Gain — Buyers Queue, Sellers Absent
At Rs 1,293.6, the buying was done — not because demand dried up, but because the exchange wouldn't let the stock go any higher. KRN Heat Exchanger and Refrigeration Ltd locked at its upper circuit of 5% on 10 Jun 2026, with buyers queuing and no sellers willing to part with shares.
Read full news article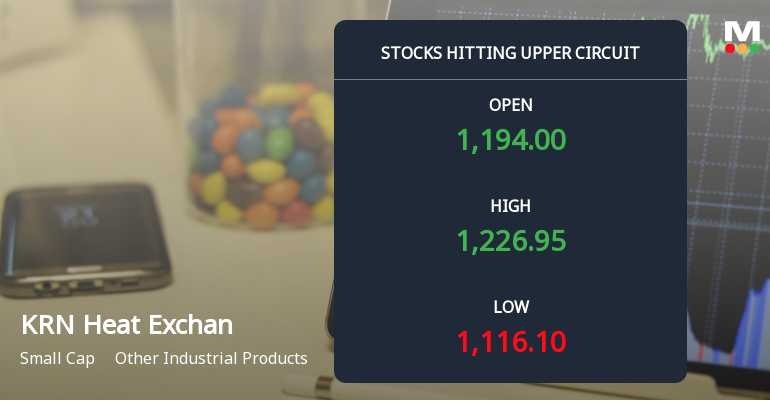
KRN Heat Exchanger and Refrigeration Ltd Locks at Upper Circuit With 5% Gain — Buyers Queue, Sellers Absent
At Rs 1,232, the buying was done — not because demand dried up, but because the exchange wouldn't let the stock go any higher. KRN Heat Exchanger and Refrigeration Ltd locked at its upper circuit of 5% on 9 Jun 2026, with buyers queuing and no sellers willing to part with shares.
Read full news article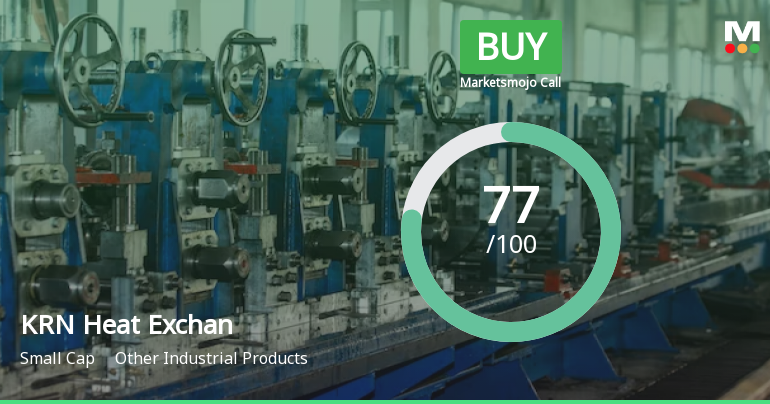
KRN Heat Exchanger and Refrigeration Ltd is Rated Buy
KRN Heat Exchanger and Refrigeration Ltd is rated Buy by MarketsMOJO, with this rating last updated on 08 April 2026. However, the analysis and financial metrics discussed here reflect the company’s current position as of 03 June 2026, providing investors with the latest insights into its performance and outlook.
Read full news article Announcements
Announcement under Regulation 30 (LODR)-Analyst / Investor Meet - Intimation
03-Jun-2026 | Source : BSEAnalysts/investors Meet
Announcement under Regulation 30 (LODR)-Meeting Updates
01-Jun-2026 | Source : BSEOutcome of Fund Raising Committee
Compliances-Reg.24(A)-Annual Secretarial Compliance
30-May-2026 | Source : BSEAnnual Secretarial Compliance Report
Corporate Actions

No Upcoming Board Meetings

No Dividend history available

No Splits history available

No Bonus history available

No Rights history available
Quality key factors
Valuation key factors
Technicals key factors
 Technical Indicator Scale: Bearish, Mildly Bearish, Sideways, Mildly Bullish, Bullish Turned
 Shareholding Snapshot : Mar 2026
Shareholding Compare (%holding)
Promoters
None
Held by 9 Schemes (2.42%)
Held by 28 FIIs (6.67%)
Anju Devi (37.5%)
Mukul Mahavir Agrawal (1.61%)
13.87%
Quarterly Results Snapshot (Consolidated) - Mar'26 - QoQ

QoQ Growth in quarter ended Mar 2026 is 17.13% vs 0.76% in Dec 2025

QoQ Growth in quarter ended Mar 2026 is 3.09% vs 25.75% in Dec 2025
Half Yearly Results Snapshot (Consolidated) - Sep'25
Growth in half year ended Sep 2025 is 43.06% vs 16.33% in Sep 2024
Growth in half year ended Sep 2025 is 25.37% vs 24.70% in Sep 2024
Nine Monthly Results Snapshot (Consolidated) - Dec'25
YoY Growth in nine months ended Dec 2025 is 40.97% vs 31.85% in Dec 2024
YoY Growth in nine months ended Dec 2025 is 39.70% vs 39.03% in Dec 2024
Annual Results Snapshot (Consolidated) - Mar'26
YoY Growth in year ended Mar 2026 is 39.60% vs 39.43% in Mar 2025
YoY Growth in year ended Mar 2026 is 44.61% vs 34.25% in Mar 2025
About KRN Heat Exchanger and Refrigeration Ltd

Company Coordinates


