
Compare KSH Internationa with Similar Stocks
Stock DNA
Industrial Products
INR 5,553 Cr (Small Cap)
50.00
37
0.00%
1.37
31.78%
15.82
Total Returns (Price + Dividend) 
KSH Internationa for the last several years.
Risk Adjusted Returns v/s
Returns Beta

News
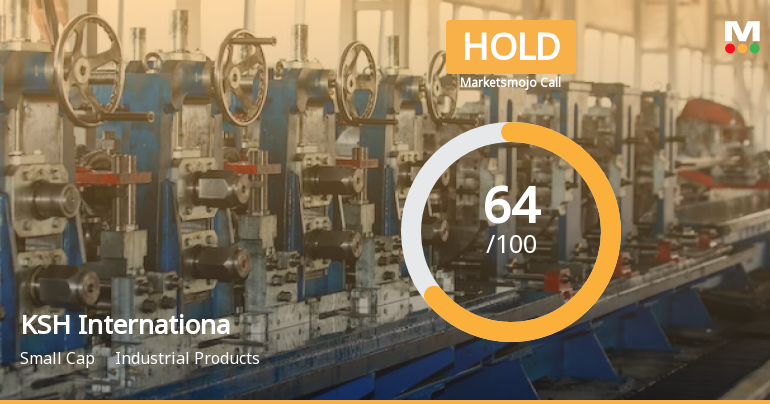
KSH International Ltd is Rated Hold
KSH International Ltd is rated 'Hold' by MarketsMOJO, with this rating last updated on 18 May 2026. However, the analysis and financial metrics discussed here reflect the stock's current position as of 10 June 2026, providing investors with an up-to-date perspective on the company’s performance and outlook.
Read full news article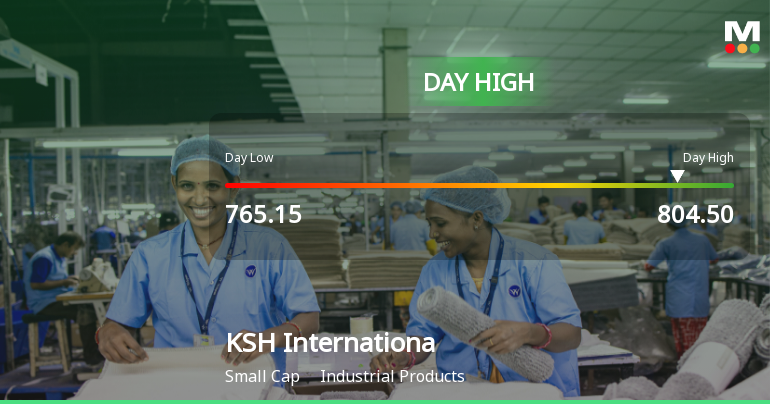
KSH International Ltd Surges 7.91% to Day's High of Rs 804.5 — Outperforms Sector by 6.68 Percentage Points
The Sensex edged up 0.48% on 09 Jun 2026, while KSH International Ltd surged 7.91%, outperforming its Industrial Products sector by 6.68 percentage points. This sharp single-session gain stands out amid a broadly cautious market environment, signalling a stock-specific strength rather than a general market uplift.
Read full news article
Announcements
Announcement under Regulation 30 (LODR)-Newspaper Publication
06-Jun-2026 | Source : BSEKSH International Limited has submitted to the Exchange Copy of Newspaper publication regarding Notice of Postal Ballot.
Shareholder Meeting / Postal Ballot-Notice of Postal Ballot
05-Jun-2026 | Source : BSEKSH International Limited has informed the Exchange regarding Notice of Postal Ballot.
Announcement under Regulation 30 (LODR)-Analyst / Investor Meet - Intimation
01-Jun-2026 | Source : BSEKSH International Limited has informed the Exchange regarding schedule of multiple group/ one-on-one meetings with analysts/investors.
Corporate Actions

No Upcoming Board Meetings

No Dividend history available

No Splits history available

No Bonus history available

No Rights history available
Quality key factors
Valuation key factors
Technicals key factors
 Technical Indicator Scale: Bearish, Mildly Bearish, Sideways, Mildly Bullish, Bullish Turned
 Shareholding Snapshot : Mar 2026
Shareholding Compare (%holding)
Promoters
None
Held by 5 Schemes (11.57%)
Held by 11 FIIs (5.04%)
Kushal Subbayya Hegde (35.23%)
Kotak Mahindra Trustee Co Ltd A/c Kotak Multi Asset Allocation Fund (5.34%)
5.13%
Quarterly Results Snapshot (Standalone) - Mar'26 - QoQ

QoQ Growth in quarter ended Mar 2026 is 24.53% vs 14.83% in Dec 2025
QoQ Growth in quarter ended Mar 2026 is 48.01% vs -21.16% in Dec 2025
Half Yearly Results Snapshot (Standalone) - Sep'25
Not Applicable: The company has declared_date for only one period
Not Applicable: The company has declared_date for only one period
Nine Monthly Results Snapshot (Standalone) - Dec'25
Not Applicable: The company has declared_date for only one period
Not Applicable: The company has declared_date for only one period
Annual Results Snapshot (Standalone) - Mar'26
YoY Growth in year ended Mar 2026 is 61.13% vs 39.45% in Mar 2025

YoY Growth in year ended Mar 2026 is 61.98% vs 82.03% in Mar 2025
About KSH International Ltd

Company Coordinates


