
Compare Ksolves India with Similar Stocks
Stock DNA
Computers - Software & Consulting
INR 683 Cr (Micro Cap)
20.00
20
3.89%
-0.05
116.85%
22.85
Total Returns (Price + Dividend) 
Latest dividend: 4.9496336996337 per share ex-dividend date: Jan-27-2026
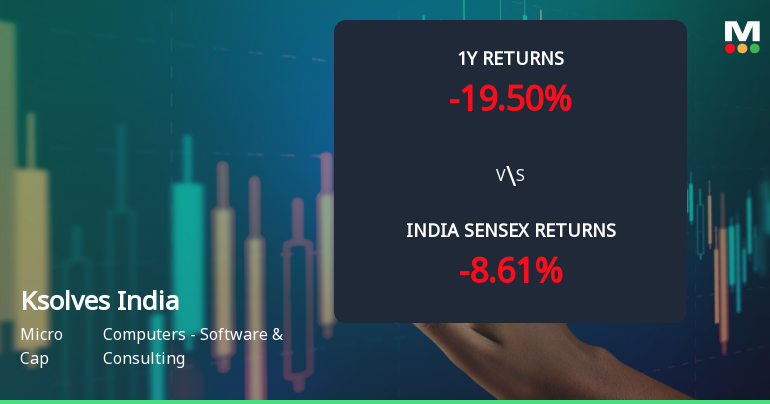
Risk Adjusted Returns v/s
Returns Beta

News
Ksolves India Ltd Technical Momentum Shifts Amid Bearish Signals
Ksolves India Ltd, a micro-cap player in the Computers - Software & Consulting sector, has experienced a notable shift in its technical momentum, moving from mildly bearish to a more pronounced bearish stance. Recent technical indicators, including MACD, RSI, and moving averages, signal increased downward pressure on the stock, which closed at ₹284.20 on 9 Jul 2026, down 3.99% from the previous close of ₹296.00.
Read full news article
Ksolves India Ltd Technical Momentum Shifts Amid Mixed Market Signals
Ksolves India Ltd, a micro-cap player in the Computers - Software & Consulting sector, has exhibited a nuanced shift in its technical momentum, moving from a bearish stance to a mildly bearish outlook. Despite a modest day gain of 0.47% to close at ₹290.15, the stock’s technical indicators present a complex picture, reflecting mixed signals across weekly and monthly timeframes.
Read full news article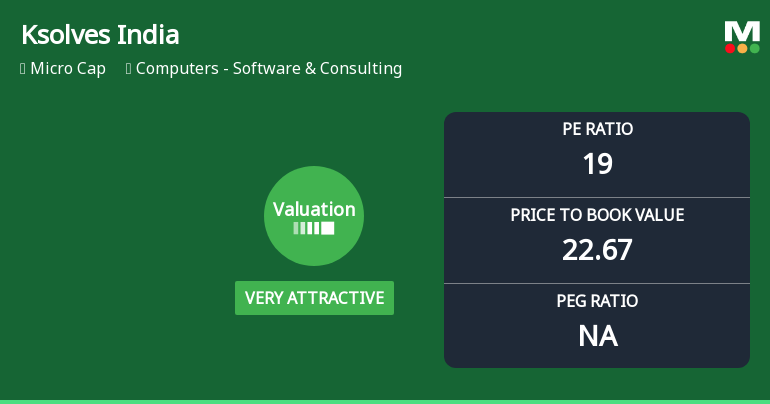
Ksolves India Ltd Valuation Shifts Signal Renewed Price Attractiveness
Ksolves India Ltd, a micro-cap player in the Computers - Software & Consulting sector, has seen a notable shift in its valuation parameters, moving from an attractive to a very attractive rating. Despite recent market headwinds and a modest decline in share price, the company’s improved price-to-earnings and price-to-book ratios, alongside robust return metrics, suggest a compelling investment case relative to its peers and historical benchmarks.
Read full news article Announcements
Corporate Actions

15 Jul 2026

Ksolves India Ltd has declared 100% dividend, ex-date: 27 Jan 26

Ksolves India Ltd has announced 5:10 stock split, ex-date: 06 Feb 25

Ksolves India Ltd has announced 1:1 bonus issue, ex-date: 06 Sep 21

No Rights history available
Quality key factors
Valuation key factors
Technicals key factors
 Technical Indicator Scale: Bearish, Mildly Bearish, Sideways, Mildly Bullish, Bullish Turned
 Shareholding Snapshot : Mar 2026
Shareholding Compare (%holding)
Promoters
None
Held by 0 Schemes
Held by 4 FIIs (0.08%)
Ratan Kumar Srivastva (31.8%)
Sachin Balkrishna Ramdasi (5.28%)
37.78%
Quarterly Results Snapshot (Consolidated) - Mar'26 - QoQ

QoQ Growth in quarter ended Mar 2026 is 1.73% vs 6.63% in Dec 2025
QoQ Growth in quarter ended Mar 2026 is -1.12% vs 16.53% in Dec 2025
Half Yearly Results Snapshot (Consolidated) - Sep'25
Growth in half year ended Sep 2025 is 16.49% vs 33.39% in Sep 2024
Growth in half year ended Sep 2025 is -18.25% vs 14.66% in Sep 2024
Nine Monthly Results Snapshot (Consolidated) - Dec'25
YoY Growth in nine months ended Dec 2025 is 14.94% vs 33.12% in Dec 2024
YoY Growth in nine months ended Dec 2025 is -13.46% vs 14.94% in Dec 2024
Annual Results Snapshot (Consolidated) - Mar'26
YoY Growth in year ended Mar 2026 is 18.37% vs 26.50% in Mar 2025
YoY Growth in year ended Mar 2026 is 0.03% vs 0.47% in Mar 2025
About Ksolves India Ltd

Company Coordinates


