
Compare KSR Footwear with Similar Stocks
Dashboard
Weak Long Term Fundamental Strength with an average Return on Capital Employed (ROCE) of 0%
- Poor long term growth as Net Sales has grown by an annual rate of 0% and Operating profit at 0% over the last 5 years
- Low ability to service debt as the company has a high Debt to EBITDA ratio of -4.10 times
Risky - Negative EBITDA
Falling Participation by Institutional Investors
Stock DNA
Footwear
INR 56 Cr (Micro Cap)
NA (Loss Making)
19
0.00%
0.41
-16.20%
0.73
Total Returns (Price + Dividend) 
KSR Footwear for the last several years.
Risk Adjusted Returns v/s
Returns Beta

News

KSR Footwear Ltd Locks at Upper Circuit With 4.97% Gain — Buyers Queue, Sellers Absent
At Rs 31.24, the buying was done — not because demand dried up, but because the exchange wouldn't let the stock go any higher. KSR Footwear Ltd locked at its upper circuit of 4.97% on 17 Jul 2026, with buyers queuing and no sellers willing to part with shares.
Read full news article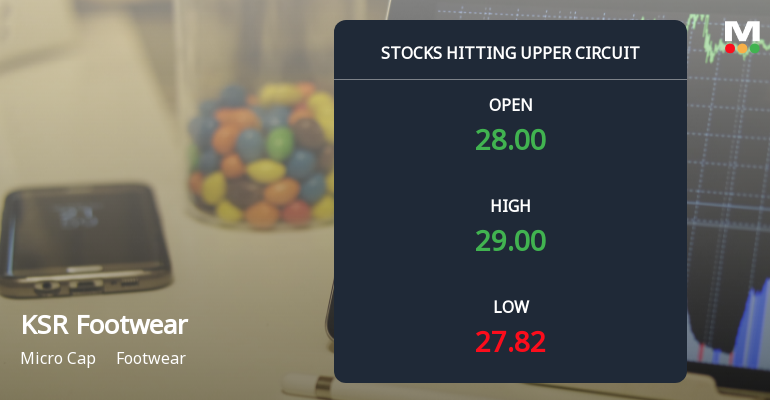
KSR Footwear Ltd Locks at Upper Circuit With 4.95% Gain — Buyers Queue, Sellers Absent
At Rs 29.07, the buying was done — not because demand dried up, but because the exchange wouldn't let the stock go any higher. KSR Footwear Ltd locked at its upper circuit of 4.95% on 15 Jul 2026, with buyers queuing and no sellers willing to part with shares.
Read full news article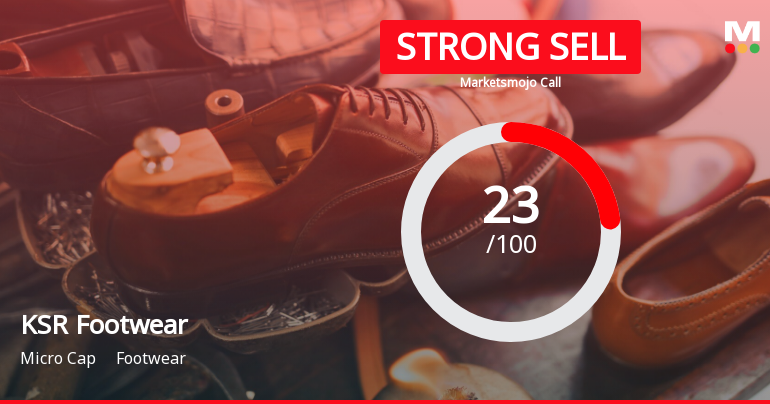
KSR Footwear Ltd is Rated Strong Sell
KSR Footwear Ltd is rated Strong Sell by MarketsMOJO, with this rating last updated on 01 July 2026. However, the analysis and financial metrics discussed here reflect the stock’s current position as of 15 July 2026, providing investors with the most recent and relevant data to assess the company’s outlook.
Read full news article Announcements
List Of Authorised Persons Under Regulation 30(5) Of The SEBI (Listing Obligations And Disclosure Requirements) Regulations 2015
01-Jul-2026 | Source : BSEList of Authorised Persons under Regulation 30(5) of the SEBI (Listing Obligations and Disclosure Requirements) Regulations 2015
Appointment Of Senior Management Personnel
01-Jul-2026 | Source : BSEMr. Vikram Jeet Sharma has been appointed as DGM-Strategic Planning & Commercial (also a Senior Management Personnel) w.e.f. July 01 2026
Announcement under Regulation 30 (LODR)-Resignation of Chief Financial Officer (CFO)
01-Jul-2026 | Source : BSEMr. Suvajit Choudhury has resigned from the position of Chief Financial Officer of the Company with effect from close of business hours of June 30 2026 consequent upon his transfer to the Commercial Department of the Company.
Corporate Actions

No Upcoming Board Meetings

No Dividend history available

No Splits history available

No Bonus history available

No Rights history available
Quality key factors
Valuation key factors
Technicals key factors
 Technical Indicator Scale: Bearish, Mildly Bearish, Sideways, Mildly Bullish, Bullish Turned
 Shareholding Snapshot : Mar 2026
Shareholding Compare (%holding)
Promoters
None
Held by 0 Schemes
Held by 1 FIIs (0.01%)
Khadim Development Company Private Limited (50.46%)
Bharadhwajan Jaganathan Velamur (4.49%)
33.89%
Quarterly Results Snapshot (Standalone) - Mar'26 - QoQ

QoQ Growth in quarter ended Mar 2026 is 33.47% vs 6.46% in Dec 2025
QoQ Growth in quarter ended Mar 2026 is 232.38% vs 58.14% in Dec 2025
Half Yearly Results Snapshot (Standalone) - Sep'25
Not Applicable: The company has declared_date for only one period
Not Applicable: The company has declared_date for only one period
Nine Monthly Results Snapshot (Standalone) - Dec'25
Not Applicable: The company has declared_date for only one period
Not Applicable: The company has declared_date for only one period
Annual Results Snapshot (Standalone) - Mar'26
Not Applicable: The company has declared_date for only one period
Not Applicable: The company has declared_date for only one period
About KSR Footwear Ltd

Company Coordinates


