
Compare KSR Footwear with Similar Stocks
Dashboard
Weak Long Term Fundamental Strength with an average Return on Capital Employed (ROCE) of 0%
- Poor long term growth as Net Sales has grown by an annual rate of 0% and Operating profit at 0% over the last 5 years
- Low ability to service debt as the company has a high Debt to EBITDA ratio of -4.10 times
Risky - Negative EBITDA
Falling Participation by Institutional Investors
Stock DNA
Footwear
INR 57 Cr (Micro Cap)
NA (Loss Making)
NA
0.00%
0.41
-16.20%
0.79
Total Returns (Price + Dividend) 
KSR Footwear for the last several years.
Risk Adjusted Returns v/s
Returns Beta

News
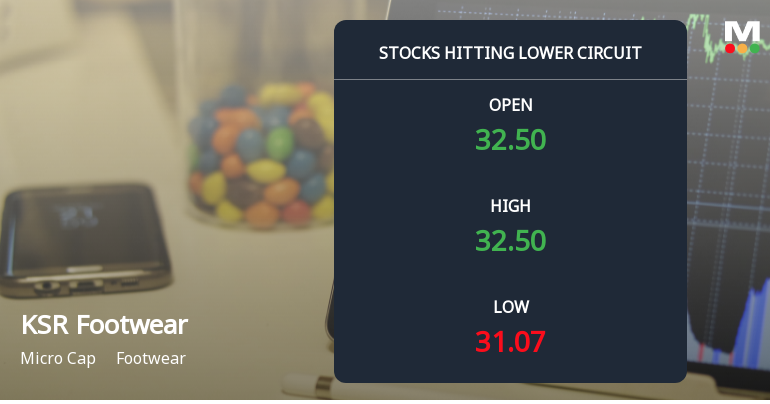
KSR Footwear Ltd Locks at Lower Circuit With 3.39% Loss — Sellers Queue, No Buyers in Sight
At Rs 31.07, sellers were still queuing — but there were no buyers willing to take the other side. KSR Footwear Ltd locked at its lower circuit of 3.39% on 7 Jul 2026, with unfilled sell orders and a frozen price, reflecting persistent selling pressure in a micro-cap stock with limited liquidity.
Read full news article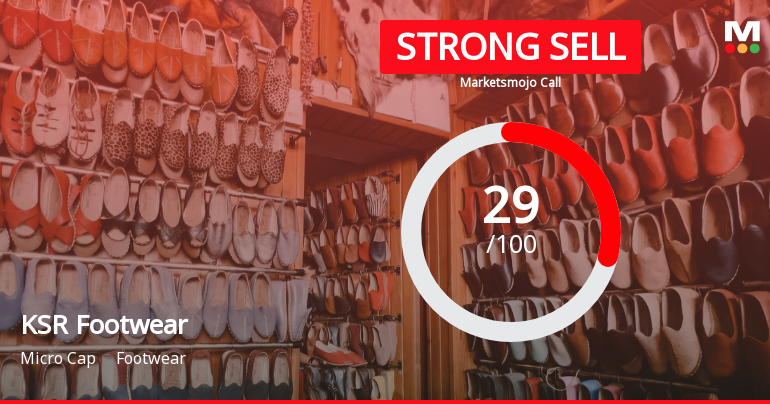
KSR Footwear Ltd Downgraded to Strong Sell Amid Technical and Fundamental Concerns
KSR Footwear Ltd has seen its investment rating downgraded from Sell to Strong Sell as of 1 July 2026, reflecting deteriorating technical indicators and persistent fundamental challenges. Despite a notable year-to-date stock return of 73.7%, the company’s weak financial health, poor valuation metrics, and sideways technical trend have raised significant concerns among analysts and institutional investors alike.
Read full news article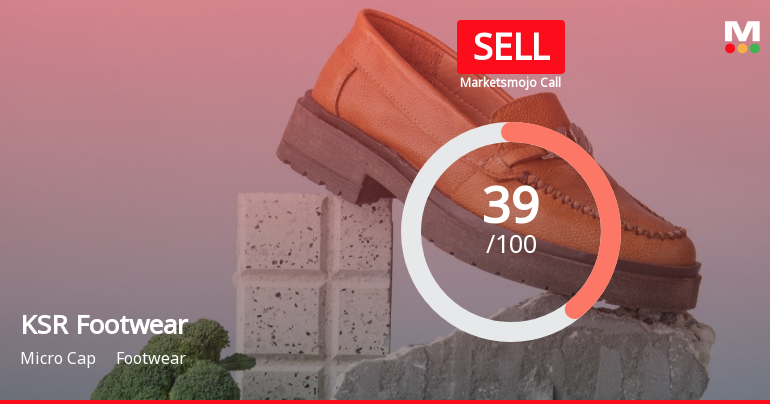
KSR Footwear Ltd is Rated Sell by MarketsMOJO
KSR Footwear Ltd is rated 'Sell' by MarketsMOJO, with this rating last updated on 15 June 2026. However, the analysis and financial metrics discussed here reflect the stock's current position as of 25 June 2026, providing investors with an up-to-date view of the company’s fundamentals, valuation, financial trends, and technical outlook.
Read full news article Announcements
Corporate Actions

No Upcoming Board Meetings

No Dividend history available

No Splits history available

No Bonus history available

No Rights history available
Quality key factors
Valuation key factors
Technicals key factors
 Technical Indicator Scale: Bearish, Mildly Bearish, Sideways, Mildly Bullish, Bullish Turned
 Shareholding Snapshot : Mar 2026
Shareholding Compare (%holding)
Promoters
None
Held by 0 Schemes
Held by 1 FIIs (0.01%)
Khadim Development Company Private Limited (50.46%)
Bharadhwajan Jaganathan Velamur (4.49%)
33.89%
Quarterly Results Snapshot (Standalone) - Mar'26 - QoQ

QoQ Growth in quarter ended Mar 2026 is 33.47% vs 6.46% in Dec 2025
QoQ Growth in quarter ended Mar 2026 is 232.38% vs 58.14% in Dec 2025
Half Yearly Results Snapshot (Standalone) - Sep'25
Not Applicable: The company has declared_date for only one period
Not Applicable: The company has declared_date for only one period
Nine Monthly Results Snapshot (Standalone) - Dec'25
Not Applicable: The company has declared_date for only one period
Not Applicable: The company has declared_date for only one period
Annual Results Snapshot (Standalone) - Mar'26
Not Applicable: The company has declared_date for only one period
Not Applicable: The company has declared_date for only one period
About KSR Footwear Ltd

Company Coordinates


