
Compare L&T Finance Ltd with Similar Stocks
Stock DNA
Non Banking Financial Company (NBFC)
INR 66,033 Cr (Mid Cap)
22.00
9
1.05%
3.94
10.73%
2.31
Total Returns (Price + Dividend) 
Latest dividend: 2.7 per share ex-dividend date: May-22-2026
Risk Adjusted Returns v/s
Returns Beta

News
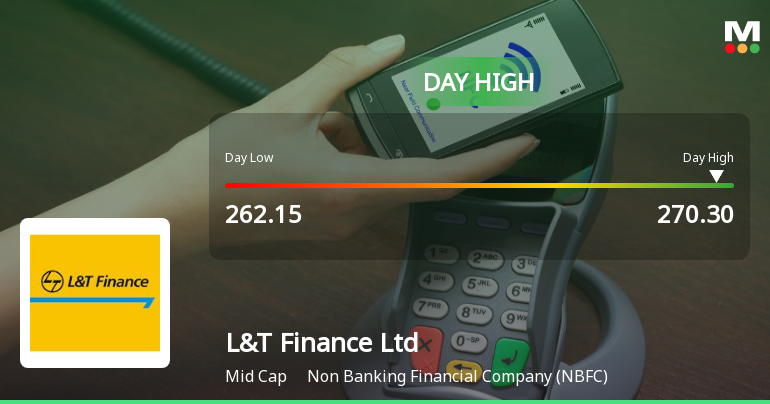
L&T Finance Ltd Surges 5.02% to Day's High of Rs 269.8 — Outperforms Sector by 3.1 Percentage Points
The Sensex gained 1.16% on 12 Jun 2026, yet L&T Finance Ltd outpaced the broader market with a 5.02% rise, reaching an intraday high of Rs 269.8. This 3.1 percentage-point outperformance over its NBFC sector peers signals a distinctly stock-specific rally rather than a mere market tailwind.
Read full news article
L&T Finance Ltd Downgraded to Hold Amid Mixed Technical and Valuation Signals
L&T Finance Ltd, a prominent player in the Non Banking Financial Company (NBFC) sector, has seen its investment rating downgraded from Buy to Hold as of 1 June 2026. This adjustment reflects a nuanced reassessment across four key parameters: quality, valuation, financial trend, and technical indicators. Despite robust quarterly financials and strong long-term returns, evolving market dynamics and technical signals have prompted a more cautious stance.
Read full news article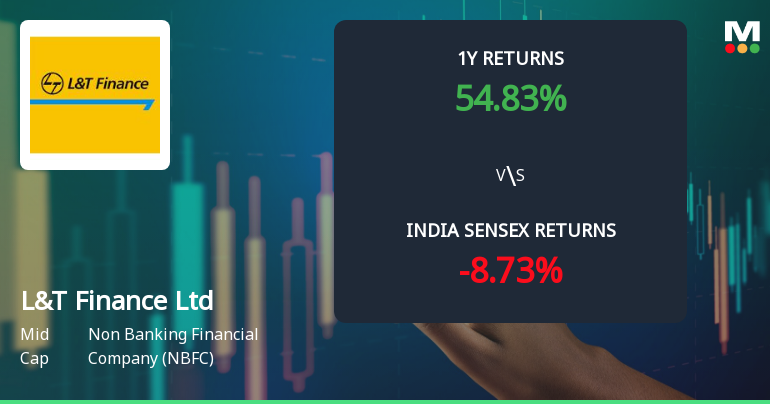
L&T Finance Ltd Technical Momentum Shifts Amid Market Volatility
L&T Finance Ltd, a mid-cap player in the Non Banking Financial Company (NBFC) sector, has experienced a notable shift in its technical momentum, moving from a bullish to a mildly bullish stance. Despite a sharp 5.57% drop in its share price on 2 June 2026, the stock’s broader technical indicators present a complex picture, with mixed signals from MACD, RSI, Bollinger Bands, and moving averages. This article delves into the detailed technical analysis and market context to provide investors with a comprehensive understanding of the stock’s current positioning.
Read full news article Announcements
Announcement under Regulation 30 (LODR)-Analyst / Investor Meet - Intimation
03-Jun-2026 | Source : BSEPlease find enclosed intimation for investor meet
Announcement under Regulation 30 (LODR)-Allotment of ESOP / ESPS
29-May-2026 | Source : BSEPlease find enclosed intimation for allotment of equity shares pursuant to exercise of ESOP
Announcement under Regulation 30 (LODR)-Amendments to Memorandum & Articles of Association
29-May-2026 | Source : BSEPlease find enclosed intimation for amendment to MOA of the Company.
Corporate Actions

No Upcoming Board Meetings

L&T Finance Ltd has declared 27% dividend, ex-date: 22 May 26

No Splits history available

No Bonus history available

L&T Finance Ltd has announced 17:74 rights issue, ex-date: 21 Jan 21
Quality key factors
Valuation key factors
Technicals key factors
 Technical Indicator Scale: Bearish, Mildly Bearish, Sideways, Mildly Bullish, Bullish Turned
 Shareholding Snapshot : Mar 2026
Shareholding Compare (%holding)
Promoters
None
Held by 31 Schemes (11.54%)
Held by 338 FIIs (7.63%)
Larsen & Toubro Limited (65.99%)
Mirae Asset Large & Midcap Fund (1.92%)
9.44%
Quarterly Results Snapshot (Consolidated) - Mar'26 - YoY

YoY Growth in quarter ended Mar 2026 is 18.60% vs 9.61% in Mar 2025
YoY Growth in quarter ended Mar 2026 is 26.79% vs 14.86% in Mar 2025
Half Yearly Results Snapshot (Consolidated) - Sep'25

Growth in half year ended Sep 2025 is 10.14% vs 21.32% in Sep 2024
Growth in half year ended Sep 2025 is 3.97% vs 22.65% in Sep 2024
Nine Monthly Results Snapshot (Consolidated) - Dec'25
YoY Growth in nine months ended Dec 2025 is 10.69% vs 19.41% in Dec 2024
YoY Growth in nine months ended Dec 2025 is 8.32% vs 13.66% in Dec 2024
Annual Results Snapshot (Consolidated) - Mar'26
YoY Growth in year ended Mar 2026 is 12.49% vs 17.29% in Mar 2025
YoY Growth in year ended Mar 2026 is 12.77% vs 13.95% in Mar 2025
About L&T Finance Ltd

Company Coordinates


