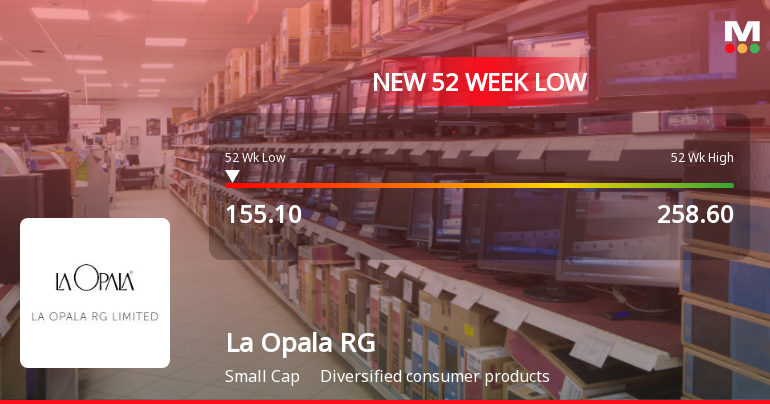
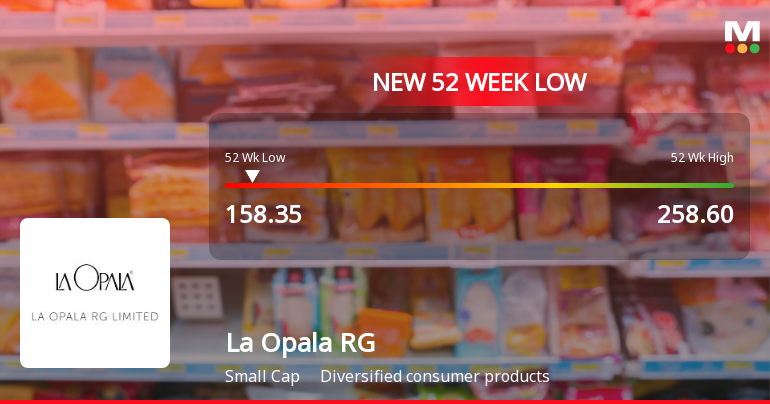
La Opala RG

  • Market Cap: Small Cap
  • Industry: Diversified consumer products
  • ISIN: INE059D01020
  • NSEID: LAOPALA
  • BSEID: 526947
INR
161.55
-2.15 (-1.31%)
BSENSE

Sep 21, 03:32 PM

BSE+NSE Vol: 1.23 lacs

  • Price Points
  • Score
  • Mojo Parameters
  • Total Return
  • News and Corporate Actions
  • Key factors
  • Shareholding
  • Financials
  • CompanyCV
stock-summaryPrice Point
High/Low

1Day

52 Week

Valuation
Technical
Day's Volume

CASH

1.23 lacs (-59.48%) Volume

Shareholding (Jun 2026)

FII

0.48%

Held by 30 FIIs

DII

18.60%

Held by 21 DIIs

Promoter

66.28%

Why is La Opala RG Ltd falling/rising?

06-Sep-2026

As of 05-Sep, La Opala RG Ltd's stock price is rising to 173.80, but it has significantly underperformed over the long term with a year-to-date decline of 14.11% and a 59.68% drop over three years. Despite the short-term increase, investor participation is down, indicating cautious sentiment amid flat recent results and reduced institutional confidence.

As of 05-Sep, La Opala RG Ltd's stock price is rising, currently at 173.80, reflecting a change of 2.05 (1.19%) upward. This rise comes after a trend reversal, as the stock has gained following four consecutive days of decline. Additionally, it has outperformed its sector by 1.19% today. However, despite this short-term increase, the stock has shown significant underperformance over longer periods, with a year-to-date decline of 14.11% and a staggering 59.68% drop over the past three years.<BR><BR>The stock's current performance is also contrasted by a decrease in investor participation, as evidenced by a 64.52% drop in delivery volume compared to the five-day average. This suggests that while the stock is experiencing a temporary rise, the overall sentiment may still be cautious, particularly given its poor long-term growth metrics, such as a net sales growth of only 6.20% annually over the last five years.<BR><BR>Moreover, the company is net-debt free, which is a positive factor, but it faces challenges with flat results in recent quarters, including a 12.5% decline in profit before tax compared to previous averages. Institutional investors have also reduced their stakes, indicating a lack of confidence in the stock's future performance. Overall, while the stock is currently rising, the broader context of its performance and investor sentiment suggests a complex situation.

View full answer

Who are in the management team of La Opala RG?

01-Sep-2026

The management team of La Opala RG includes Sushil Jhunjhunwala (Chairman & Executive Director), Ajit Jhunjhunwala (Vice Chairman & Managing Director), and several independent directors, ensuring a blend of executive leadership and independent oversight. Nidhi Rathi serves as the Company Secretary & Compliance Officer.

The management team of La Opala RG includes the following key individuals:<BR><BR>1. **Sushil Jhunjhunwala** - Chairman & Executive Director<BR>2. **Ajit Jhunjhunwala** - Vice Chairman & Managing Director<BR>3. **Nidhi Jhunjhunwala** - Executive Director<BR>4. **Arun Churiwal** - Non-Executive & Non-Independent Director<BR>5. **Rajiv Gujral** - Non-Executive & Independent Director<BR>6. **Santanu Ray** - Non-Executive & Independent Director<BR>7. **Suparna Chakrabortti** - Independent Director<BR>8. **Subir Bose** - Independent Director<BR>9. **Nidhi Rathi** - Company Secretary & Compliance Officer<BR><BR>This team brings a mix of executive and independent oversight to the company.

View full answer

What does La Opala RG do?

01-Sep-2026

La Opala RG Ltd is a small-cap company specializing in the manufacturing and marketing of glassware lifestyle products. As of June 2026, it reported net sales of ₹71 Cr and a net profit of ₹26 Cr, with a market cap of ₹1,909 Cr.

Overview:<BR>La Opala RG Ltd is a leading manufacturer and marketer of lifestyle products in the glassware segment, operating within the diversified consumer products industry and categorized as a small-cap company.<BR><BR>History:<BR>La Opala RG Limited was incorporated in June 1987. The company went public in February 1995. The latest quarterly results reported net sales and net profit for June 2026.<BR><BR>Financial Snapshot:<BR>Net Sales: 71 Cr (Quarterly Results - Jun 2026) <BR>Net Profit: 26 Cr (Quarterly Results - Jun 2026) <BR>Market Cap: INR 1,909 Cr (Small Cap)<BR><BR>Key Metrics:<BR>P/E: 20.00 <BR>Industry P/E: 34 <BR>Dividend Yield: 2.87% <BR>Debt Equity: -0.63 <BR>Return on Equity: 11.52% <BR>Price to Book: 2.36 <BR><BR>Contact Details:<BR>Address: Chitrakoot (10th Floor), 230 A Acharya J C Bose Road Kolkata West Bengal : 700020 <BR>Tel: 91-033-760488814/5/6/7 <BR>Email: info@laopala.in <BR>Website: http://www.laopala.in

View full answer

Who are the peers of the La Opala RG?

01-Sep-2026

La Opala RG's peers include Borosil, Pokarna, Somany Ceramics, Nitco, Virtuoso Optoel., Hindware Home In, Asian Granito, Bhartiya Intl., and Orient Bell. In terms of management risk, growth, and capital structure, La Opala RG is rated similarly to Borosil, with a 1-year return of -28.49%, better than Hindware Home In but worse than Somany Ceramics.

Peers: The peers of La Opala RG are Borosil, Pokarna, Somany Ceramics, Nitco, Virtuoso Optoel., Hindware Home In, Asian Granito, Bhartiya Intl., and Orient Bell.<BR><BR>Quality Snapshot: Excellent management risk is observed at Borosil and La Opala RG, while Good management risk is found at Pokarna and Somany Ceramics, and Average management risk is noted at Virtuoso Optoel., Hindware Home In, Bhartiya Intl., and Orient Bell. Below Average management risk is present at Nitco and Asian Granito. Growth is rated as Good for Virtuoso Optoel., Average for Borosil, and Below Average for Pokarna, Somany Ceramics, La Opala RG, Hindware Home In, Asian Granito, and Bhartiya Intl., while Nitco has Below Average growth. Capital Structure is Excellent for Borosil and La Opala RG, Good for Somany Ceramics, Average for Pokarna, and Below Average for Nitco, Virtuoso Optoel., Hindware Home In, Asian Granito, and Bhartiya Intl.<BR><BR>Return Snapshot: Somany Ceramics has the highest 1-year return at 21.84%, while Hindware Home In has the lowest at -39.59%. La Opala RG's 1-year return of -28.49% is better than Hindware Home In's but worse than Somany Ceramics'. Additionally, the six-month returns for Hindware Home In, Asian Granito, and La Opala RG are negative.

View full answer

How big is La Opala RG?

01-Sep-2026

As of 31st August, La Opala RG Ltd has a market capitalization of 1,909.00 Cr, with recent Net Sales of 315.15 Cr and a Net Profit of 93.15 Cr. Shareholder's Funds are 820.36 Cr and Total Assets are 894.58 Cr as of March 2026.

As of 31st August, La Opala RG Ltd has a market capitalization of 1,909.00 Cr, categorizing it as a Small Cap company.<BR><BR>In the latest four quarters, La Opala RG reported Net Sales of 315.15 Cr and a Net Profit of 93.15 Cr.<BR><BR>The latest reporting period for the balance sheet is March 2026, with Shareholder's Funds amounting to 820.36 Cr and Total Assets of 894.58 Cr.

View full answer

Should I buy, sell or hold La Opala RG Ltd?

21-Aug-2026

Are La Opala RG Ltd latest results good or bad?

31-May-2026

La Opala RG Ltd's latest results are concerning, with a 37.07% drop in net profit and an 11.30% decline in revenue year-on-year, indicating challenges in the consumer environment and raising doubts about the company's near-term recovery prospects.

La Opala RG Ltd's latest results indicate a challenging period for the company. In Q4 FY26, the net profit dropped significantly by 37.07% year-on-year to ₹16.17 crores, and revenue also contracted by 11.30% year-on-year to ₹68.39 crores. This decline in revenue marks a sequential decrease of 19.07% from the previous quarter, highlighting a concerning trend.<BR><BR>While the operating margin showed some resilience, improving to 36.26% from the previous year, the overall profitability has been adversely affected by a sharp reduction in other income and a higher effective tax rate. The profit after tax margin fell dramatically, indicating that the company is struggling to maintain its profitability amidst declining sales.<BR><BR>The results reflect broader challenges in the consumer environment, particularly in discretionary spending, which is impacting La Opala RG's performance in the premium opalware and glassware segments. Given these factors, the latest results can be characterized as bad, raising concerns about the company's near-term recovery prospects and overall operational momentum.

View full answer

When is the next results date for La Opala RG Ltd?

27-May-2026

La Opala RG Ltd will declare its results on 30 May 2026.

La Opala RG Ltd will declare its results on 30 May 2026.

View full answer

How has been the historical performance of La Opala RG?

09-Nov-2025

La Opala RG has experienced a decline in net sales, operating profit, and profits after tax from March 2023 to March 2025, despite an increase in total assets and improved cash flow from operating activities. Total liabilities also rose during this period, reflecting a challenging financial environment.

Answer:<BR>The historical performance of La Opala RG shows a fluctuating trend in key financial metrics over the years.<BR><BR>Breakdown:<BR>La Opala RG's net sales have seen a decline from INR 452.32 crore in March 2023 to INR 331.86 crore in March 2025, with a notable drop from INR 365.13 crore in March 2024. The total operating income followed a similar trend, decreasing to INR 331.86 crore in March 2025 from INR 452.32 crore in March 2023. The company's operating profit (PBDIT) also decreased, reaching INR 156.02 crore in March 2025, down from INR 193.95 crore in March 2023. Profit before tax declined to INR 132.44 crore in March 2025 from INR 164.70 crore in March 2023, while profit after tax fell to INR 96.59 crore in March 2025 from INR 122.98 crore in March 2023. The company's total assets increased to INR 901.15 crore in March 2025 from INR 896.92 crore in March 2023, while total liabilities rose to INR 901.15 crore in March 2025 from INR 927.26 crore in March 2024. Cash flow from operating activities improved to INR 112 crore in March 2025, up from INR 68 crore in March 2024, indicating a positive trend in cash generation despite the overall decline in sales and profits.

View full answer

Is La Opala RG technically bullish or bearish?

30-Sep-2025

As of 29 September 2025, La Opala RG's technical trend has shifted to bearish, indicated by negative signals from MACD, Bollinger Bands, and moving averages, despite a bullish monthly OBV.

As of 29 September 2025, the technical trend for La Opala RG has changed from mildly bearish to bearish. The current stance is bearish with a strong indication of weakness. Key indicators driving this assessment include bearish signals from the MACD on both weekly and monthly time frames, bearish readings from Bollinger Bands, and a bearish daily moving average. The KST also reflects a bearish trend on both weekly and monthly levels. Although the OBV shows a bullish trend on a monthly basis, the overall technical picture is dominated by bearish signals across multiple indicators and time frames.

View full answer

Who are the top shareholders of the La Opala RG?

06-Jun-2025

The top shareholders of La Opala RG include Genesis Exports Private Limited with 46.64%, mutual funds holding 19.55% (led by HDFC Small Cap Fund at 8.32%), individual investors with 10.9%, and 44 Foreign Institutional Investors with 0.92%. There are no pledged promoter holdings.

The top shareholders of La Opala RG include several key players. The majority shareholder is Genesis Exports Private Limited, which holds a significant 46.64% of the company. Additionally, mutual funds collectively hold 19.55% through four different schemes, with HDFC Small Cap Fund being the highest public shareholder at 8.32%. Individual investors also have a notable presence, owning 10.9% of the shares. There are 44 Foreign Institutional Investors (FIIs) holding a smaller portion, amounting to 0.92%. Notably, there are no pledged promoter holdings.

View full answer

What is the bonus history of the La Opala RG?

06-Jun-2025

La Opala RG has issued bonuses twice: a 1:1 bonus on March 22, 2018, and another 1:1 bonus on September 25, 2006, demonstrating a consistent practice of rewarding shareholders.

La Opala RG has a history of bonus issues that includes two significant instances. The most recent bonus was a 1:1 bonus issue announced with an ex-date of March 22, 2018, and the record date was March 23, 2018. Prior to that, the company also issued a 1:1 bonus on September 25, 2006, with a record date of September 26, 2006. This indicates a consistent approach to rewarding shareholders through bonus shares over the years.

View full answer

Has La Opala RG declared dividend?

06-Jun-2025

La Opala RG Ltd has declared a 250% dividend, amounting to ₹5 per share, with an ex-date of September 23, 2024. Despite this significant dividend, total returns over various periods show mixed performance, with declines in the short term but a strong recovery over the past five years.

La Opala RG Ltd has declared a 250% dividend.<BR><BR>Dividend Details:<BR>- Percentage announced: 250%<BR>- Amount per share: 5<BR>- Ex-date: 23 Sep 24<BR><BR>Dividend Yield: 4.13%.<BR><BR>Total Returns by Period:<BR>In the last 6 months, the price return was -27.24%, with a dividend return of 0%, resulting in a total return of -27.24%.<BR><BR>Over the past year, the price return was -19.18%, the dividend return was 1.54%, leading to a total return of -17.64%.<BR><BR>In the 2-year period, the price return was -39.94%, the dividend return was 1.97%, culminating in a total return of -37.97%.<BR><BR>For the 3-year period, the price return was -5.66%, the dividend return was 4.22%, resulting in a total return of -1.44%.<BR><BR>In the last 4 years, the price return was -12.67%, the dividend return was 5.24%, which led to a total return of -7.43%.<BR><BR>Over the past 5 years, the price return was 46.83%, with a dividend return of 7.33%, resulting in a total return of 54.16%.<BR><BR>Overall, while La Opala RG Ltd has declared a significant dividend, the total returns over various periods indicate a mixed performance, with notable declines in the shorter terms but a strong recovery in the longer term.

View full answer
iScoreScore
Click here to find our call on this stock
Strong Sell
Sell
Hold
Buy
Strong Buy

Dashboard

1

Poor long term growth as Net Sales has grown by an annual rate of 6.20% and Operating profit at 7.03% over the last 5 years

 
2

Flat results in Jun 26

3

Falling Participation by Institutional Investors

4

Consistent Underperformance against the benchmark over the last 3 years

stock-summaryMojo Parameters

Mojo Parameters

Loading Valuation Snapshot...

Stock DNA

stock-summary
Industry

Diversified consumer products

stock-summary
Market cap

INR 1,821 Cr (Small Cap)

stock-summary
P/E

19.00

stock-summary
Industry P/E

34

stock-summary
Dividend Yield

3.06%

stock-summary
Debt Equity

-0.63

stock-summary
Return on Equity

11.52%

stock-summary
Price to Book

2.21

Revenue and Profits:
Net Sales:
71 Cr
(Quarterly Results - Jun 2026)
Net Profit:
26 Cr
stock-summaryTotal Returns
Total Returns (Price + Dividend) stock-summary
Dividend Yield (3.06%)
TimePeriod
Price Return
Dividend Return
Total Return
3 Months
-11.84%
2.72%
-9.12%
6 Months
-12.22%
2.76%
-9.46%
1 Year
-35.91%
2.05%
-33.86%
2 Years
-57.61%
3.53%
-54.08%
3 Years
-61.45%
4.03%
-57.42%
4 Years
-55.4%
5.84%
-49.56%
5 Years
-44.57%
8.06%
-36.51%

Latest dividend: 4.9832073887489505 per share ex-dividend date: Aug-20-2026

Risk Adjusted Returns v/s stock-summary
Returns Beta
Icon
Beta has not been calculated since enough price history is not available
stock-summaryNews & Corporate Actions

News

La Opala RG Ltd Gains 2.89%: 3 Key Factors Driving the Week’s Recovery

Announcements stock-summary

Disclosure Under Regulation 29(2) Of SEBI (Substantial Acquisition Of Shares And Takeovers) Regulations 2011

18-Sep-2026 | Source : BSE

Please find enclosed herewith information submitted by one of our Promoter (M/s Genesis Exports Private Limited) for and on behalf of other Promoter & Promoter Group/PACs under Regulation 29(2) of the SEBI (SAST) Regulations 2011 for acquisition of 50000 Equity Shares of the Company.

Disclosures under Reg. 29(2) of SEBI (SAST) Regulations 2011

18-Sep-2026 | Source : BSE

The Exchange has received the disclosure under Regulation 29(2) of SEBI (Substantial Acquisition of Shares & Takeovers) Regulations 2011 for Genesis Exports Pvt Ltd & PACs

Disclosures under Reg. 29(2) of SEBI (SAST) Regulations 2011

18-Sep-2026 | Source : BSE

The Exchange has received the disclosure under Regulation 29(2) of SEBI (Substantial Acquisition of Shares & Takeovers) Regulations 2011 for Genesis Exports Pvt Ltd & PACs

Corporate Actions stock-summary

stock-summary
BOARD MEETING

No Upcoming Board Meetings

stock-summary
DIVIDEND

La Opala RG Ltd has declared 250% dividend, ex-date: 20 Aug 26

stock-summary
SPLITS

La Opala RG Ltd has announced 2:10 stock split, ex-date: 24 Sep 14

stock-summary
BONUS

La Opala RG Ltd has announced 1:1 bonus issue, ex-date: 22 Mar 18

stock-summary
RIGHTS

No Rights history available

stock-summaryKey Factors

Quality key factors stock-summary

Factor
Value
Sales Growth (5y)
6.20%
EBIT Growth (5y)
7.03%
EBIT to Interest (avg)
19.83
Debt to EBITDA (avg)
Net Debt is too low
Net Debt to Equity (avg)
-0.63
Sales to Capital Employed (avg)
0.44
Tax Ratio
23.36%
Dividend Payout Ratio
86.19%
Pledged Shares
0
Institutional Holding
19.08%
ROCE (avg)
29.42%
ROE (avg)
13.31%

Valuation key factors

Factor
Value
P/E Ratio
19
Industry P/E
34
Price to Book Value
2.21
EV to EBIT
13.49
EV to EBITDA
11.05
EV to Capital Employed
4.23
EV to Sales
4.12
PEG Ratio
NA
Dividend Yield
3.06%
ROCE (Latest)
30.02%
ROE (Latest)
11.52%

Technicals key factors

Indicator
Weekly
Monthly
MACD
Bearish
Mildly Bullish
RSI
No Signal
Bullish
Bollinger Bands
Mildly Bearish
Bearish
Moving Averages
Bearish (Daily)
KST
Bearish
Bearish
Dow Theory
Mildly Bearish
Mildly Bearish
OBV
No Trend
No Trend
stock-summary Technical Indicator Scale: Bearish, Mildly Bearish, Sideways, Mildly Bullish, Bullish  Turned 
stock-summaryShareholding
Shareholding Snapshot : Jun 2026stock-summary
Shareholding Compare (%holding) stock-summary
Majority shareholders

Promoters

Pledged Promoter Holdings

None

Mutual Funds

Held by 6 Schemes (18.6%)

FIIs

Held by 30 FIIs (0.48%)

Promoter with highest holding

Genesis Exports Private Limited (47.07%)

Highest Public shareholder

Hdfc Small Cap Fund (8.51%)

Individual Investors Holdings

11.4%

stock-summaryFinancial
[
  {
    "link": "quarterly",
    "btn_text": "All Quarterly Results",
    "header": "Quarterly Results Snapshot (Standalone) - Jun'26 - QoQ",
    "rhs": [
      {
        "prefix": "Net Sales ",
        "suffix": "QoQ Growth in quarter ended Jun 2026 is 4.34% vs -19.07% in Mar 2026",
        "dir": 1
      },
      {
        "prefix": "Standalone Net Profit ",
        "suffix": "QoQ Growth in quarter ended Jun 2026 is 62.03% vs -32.62% in Mar 2026",
        "dir": 1
      }
    ],
    "table": {
      "header": [
        "Jun'26",
        "Mar'26",
        "Change(%)"
      ],
      "body": [
        {
          "field": "Net Sales",
          "val1": "71.36",
          "val2": "68.39",
          "chgp": "4.34%",
          "chgp_class": "positive"
        },
        {
          "field": "Operating Profit (PBDIT) excl Other Income",
          "val1": "25.93",
          "val2": "24.80",
          "chgp": "4.56%",
          "chgp_class": "positive"
        },
        {
          "field": "Interest",
          "val1": "0.90",
          "val2": "1.02",
          "chgp": "-11.76%",
          "chgp_class": "positive"
        },
        {
          "field": "Exceptional Items",
          "val1": "0.00",
          "val2": "0.00",
          "chgp": "",
          "chgp_class": "neutral"
        },
        {
          "field": "Standalone Net Profit",
          "val1": "26.20",
          "val2": "16.17",
          "chgp": "62.03%",
          "chgp_class": "positive"
        },
        {
          "field": "Operating Profit Margin (Excl OI)",
          "val1": "36.34%",
          "val2": "36.26%",
          "chgp": "0.08%",
          "chgp_class": "positive"
        }
      ]
    }
  },
  {
    "link": "half-yearly",
    "btn_text": "All Half Yearly Results",
    "header": "Half Yearly Results Snapshot (Standalone) - Sep'25",
    "rhs": [
      {
        "prefix": "Net Sales ",
        "suffix": " Growth in half year ended Sep 2025 is -4.47% vs -6.83% in Sep 2024",
        "dir": 1
      },
      {
        "prefix": "Standalone Net Profit ",
        "suffix": " Growth in half year ended Sep 2025 is 9.24% vs -20.35% in Sep 2024",
        "dir": 1
      }
    ],
    "table": {
      "header": [
        "Sep'25",
        "Sep'24",
        "Change(%)"
      ],
      "body": [
        {
          "field": "Net Sales",
          "val1": "156.17",
          "val2": "163.47",
          "chgp": "-4.47%",
          "chgp_class": "negative"
        },
        {
          "field": "Operating Profit (PBDIT) excl Other Income",
          "val1": "59.31",
          "val2": "55.95",
          "chgp": "6.01%",
          "chgp_class": "positive"
        },
        {
          "field": "Interest",
          "val1": "2.48",
          "val2": "2.46",
          "chgp": "0.81%",
          "chgp_class": "negative"
        },
        {
          "field": "Exceptional Items",
          "val1": "0.00",
          "val2": "0.00",
          "chgp": "",
          "chgp_class": "neutral"
        },
        {
          "field": "Standalone Net Profit",
          "val1": "52.13",
          "val2": "47.72",
          "chgp": "9.24%",
          "chgp_class": "positive"
        },
        {
          "field": "Operating Profit Margin (Excl OI)",
          "val1": "37.98%",
          "val2": "34.23%",
          "chgp": "3.75%",
          "chgp_class": "positive"
        }
      ]
    }
  },
  {
    "link": "nine-monthly",
    "btn_text": "All Nine Monthly Results",
    "header": "Nine Monthly Results Snapshot (Standalone) - Dec'25",
    "rhs": [
      {
        "prefix": "Net Sales ",
        "suffix": "YoY Growth in nine months ended Dec 2025 is -5.53% vs -9.85% in Dec 2024",
        "dir": 1
      },
      {
        "prefix": "Standalone Net Profit ",
        "suffix": "YoY Growth in nine months ended Dec 2025 is 7.39% vs -31.88% in Dec 2024",
        "dir": 1
      }
    ],
    "table": {
      "header": [
        "Dec'25",
        "Dec'24",
        "Change(%)"
      ],
      "body": [
        {
          "field": "Net Sales",
          "val1": "240.67",
          "val2": "254.77",
          "chgp": "-5.53%",
          "chgp_class": "negative"
        },
        {
          "field": "Operating Profit (PBDIT) excl Other Income",
          "val1": "90.92",
          "val2": "81.59",
          "chgp": "11.44%",
          "chgp_class": "positive"
        },
        {
          "field": "Interest",
          "val1": "3.87",
          "val2": "4.05",
          "chgp": "-4.44%",
          "chgp_class": "positive"
        },
        {
          "field": "Exceptional Items",
          "val1": "-1.79",
          "val2": "0.00",
          "chgp": "",
          "chgp_class": "neutral"
        },
        {
          "field": "Standalone Net Profit",
          "val1": "76.13",
          "val2": "70.89",
          "chgp": "7.39%",
          "chgp_class": "positive"
        },
        {
          "field": "Operating Profit Margin (Excl OI)",
          "val1": "37.78%",
          "val2": "32.02%",
          "chgp": "5.76%",
          "chgp_class": "positive"
        }
      ]
    }
  },
  {
    "link": "annual",
    "btn_text": "All Annual Results",
    "header": "Annual Results Snapshot (Standalone) - Mar'26",
    "rhs": [
      {
        "prefix": "Net Sales ",
        "suffix": "YoY Growth in year ended Mar 2026 is -6.87% vs -9.11% in Mar 2025",
        "dir": 1
      },
      {
        "prefix": "Standalone Net Profit ",
        "suffix": "YoY Growth in year ended Mar 2026 is -4.44% vs -24.37% in Mar 2025",
        "dir": 1
      }
    ],
    "table": {
      "header": [
        "Mar'26",
        "Mar'25",
        "Change(%)"
      ],
      "body": [
        {
          "field": "Net Sales",
          "val1": "309.06",
          "val2": "331.86",
          "chgp": "-6.87%",
          "chgp_class": "negative"
        },
        {
          "field": "Operating Profit (PBDIT) excl Other Income",
          "val1": "115.73",
          "val2": "108.29",
          "chgp": "6.87%",
          "chgp_class": "positive"
        },
        {
          "field": "Interest",
          "val1": "4.89",
          "val2": "5.27",
          "chgp": "-7.21%",
          "chgp_class": "positive"
        },
        {
          "field": "Exceptional Items",
          "val1": "-1.79",
          "val2": "0.00",
          "chgp": "",
          "chgp_class": "neutral"
        },
        {
          "field": "Standalone Net Profit",
          "val1": "92.30",
          "val2": "96.59",
          "chgp": "-4.44%",
          "chgp_class": "negative"
        },
        {
          "field": "Operating Profit Margin (Excl OI)",
          "val1": "37.45%",
          "val2": "32.63%",
          "chgp": "4.82%",
          "chgp_class": "positive"
        }
      ]
    }
  }
]

Quarterly Results Snapshot (Standalone) - Jun'26 - QoQstock-summary

Jun'26
Mar'26
Change(%)
Net Sales
71.36
68.39
4.34%
Operating Profit (PBDIT) excl Other Income
25.93
24.80
4.56%
Interest
0.90
1.02
-11.76%
Exceptional Items
0.00
0.00
Standalone Net Profit
26.20
16.17
62.03%
Operating Profit Margin (Excl OI)
36.34%
36.26%
0.08%
Values in Rs Cr.
Direction Arrows
Net Sales

QoQ Growth in quarter ended Jun 2026 is 4.34% vs -19.07% in Mar 2026

Direction Arrows
Standalone Net Profit

QoQ Growth in quarter ended Jun 2026 is 62.03% vs -32.62% in Mar 2026

Half Yearly Results Snapshot (Standalone) - Sep'25stock-summary

Sep'25
Sep'24
Change(%)
Net Sales
156.17
163.47
-4.47%
Operating Profit (PBDIT) excl Other Income
59.31
55.95
6.01%
Interest
2.48
2.46
0.81%
Exceptional Items
0.00
0.00
Standalone Net Profit
52.13
47.72
9.24%
Operating Profit Margin (Excl OI)
37.98%
34.23%
3.75%
Values in Rs Cr.
Direction Arrows
Net Sales

Growth in half year ended Sep 2025 is -4.47% vs -6.83% in Sep 2024

Direction Arrows
Standalone Net Profit

Growth in half year ended Sep 2025 is 9.24% vs -20.35% in Sep 2024

Nine Monthly Results Snapshot (Standalone) - Dec'25stock-summary

Dec'25
Dec'24
Change(%)
Net Sales
240.67
254.77
-5.53%
Operating Profit (PBDIT) excl Other Income
90.92
81.59
11.44%
Interest
3.87
4.05
-4.44%
Exceptional Items
-1.79
0.00
Standalone Net Profit
76.13
70.89
7.39%
Operating Profit Margin (Excl OI)
37.78%
32.02%
5.76%
Values in Rs Cr.
Direction Arrows
Net Sales

YoY Growth in nine months ended Dec 2025 is -5.53% vs -9.85% in Dec 2024

Direction Arrows
Standalone Net Profit

YoY Growth in nine months ended Dec 2025 is 7.39% vs -31.88% in Dec 2024

Annual Results Snapshot (Standalone) - Mar'26stock-summary

Mar'26
Mar'25
Change(%)
Net Sales
309.06
331.86
-6.87%
Operating Profit (PBDIT) excl Other Income
115.73
108.29
6.87%
Interest
4.89
5.27
-7.21%
Exceptional Items
-1.79
0.00
Standalone Net Profit
92.30
96.59
-4.44%
Operating Profit Margin (Excl OI)
37.45%
32.63%
4.82%
Values in Rs Cr.
Direction Arrows
Net Sales

YoY Growth in year ended Mar 2026 is -6.87% vs -9.11% in Mar 2025

Direction Arrows
Standalone Net Profit

YoY Growth in year ended Mar 2026 is -4.44% vs -24.37% in Mar 2025

stock-summaryCompany CV
About La Opala RG Ltd stock-summary
stock-summary
La Opala RG Ltd
Small Cap
Diversified consumer products
La Opala RG Limited was incorporated in June, 1987. Promoted by Sushil Jhunjhunwala and Ajit Jhunjhunwala, the Company is a leading manufacturer and marketer of life style product in the glassware segment. The Kolkata-based company has a wide network of dealers and retailers and a large marketing field force. The Company's combined production capacity across 3 manufacturing units in Sitarganj and Madhupur is 32,000 MTPA. La Opala went public in Feb.'95 with an issue of 8.
Company Coordinates stock-summary
Company Details
Chitrakoot (10th Floor), 230 A Acharya J C Bose Road Kolkata West Bengal : 700020
stock-summary
Tel: 91-033-760488814/5/6/7
stock-summary
info@laopala.in
Registrar Details
Maheshwari Datamatics Pvt Ltd , 6 Mangoe Lane , 2nd Floor, Calcutta