
Compare Lakshmi Mills with Similar Stocks
Dashboard
Weak Long Term Fundamental Strength with a -3.19% CAGR growth in Operating Profits over the last 5 years
- Company's ability to service its debt is weak with a poor EBIT to Interest (avg) ratio of 0.60
- The company has been able to generate a Return on Equity (avg) of 0.77% signifying low profitability per unit of shareholders funds
Despite the size of the company, domestic mutual funds hold only 0.01% of the company
Stock DNA
Garments & Apparels
INR 522 Cr (Micro Cap)
NA (Loss Making)
23
0.00%
0.11
-2.16%
0.70
Total Returns (Price + Dividend) 
Latest dividend: 9 per share ex-dividend date: Sep-14-2023
Risk Adjusted Returns v/s
Returns Beta

News

Lakshmi Mills Downgraded to Strong Sell Amid Weak Fundamentals and Bearish Technicals
Lakshmi Mills Company Ltd, a micro-cap player in the Garments & Apparels sector, has seen its investment rating downgraded from Sell to Strong Sell as of 8 June 2026. This change reflects deteriorating technical indicators, weak long-term fundamentals, and a challenging financial trend despite some recent positive quarterly results.
Read full news article
Lakshmi Mills Company Ltd is Rated Sell
Lakshmi Mills Company Ltd is rated 'Sell' by MarketsMOJO, with this rating last updated on 21 April 2026. However, the analysis and financial metrics discussed here reflect the stock's current position as of 08 June 2026, providing investors with the latest insights into the company’s performance and outlook.
Read full news article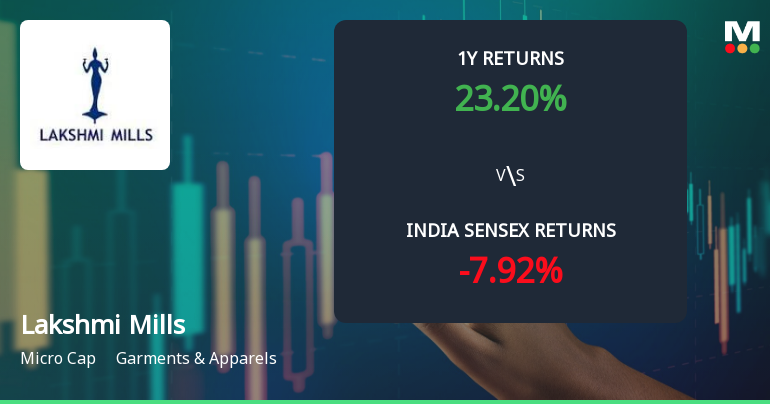
Lakshmi Mills Company Ltd Sees Technical Momentum Shift Amid Mixed Indicator Signals
Lakshmi Mills Company Ltd, a micro-cap player in the Garments & Apparels sector, has experienced a notable shift in its technical momentum, moving from a mildly bearish stance to a sideways trend. Despite a modest day gain of 1.50%, the stock’s technical indicators present a complex picture, with mixed signals across weekly and monthly timeframes, reflecting cautious optimism amid ongoing volatility.
Read full news article Announcements
Compliances-Reg.24(A)-Annual Secretarial Compliance
30-May-2026 | Source : BSEPursuant to Regulation 24A of the SEBI (LODR) Regulations 2015 please find enclosed herewith the Annual Secretarial Compliance Report for the Financial Year ended 31.03.2026
Announcement under Regulation 30 (LODR)-Newspaper Publication
19-May-2026 | Source : BSEEnclosing copy of the Newspaper Advertisement of the Audited Financial Results of the Company for the year ended 31.03.2026 published on 19.05.2026 in Business Line (English) and Dinamani (Tamil)
Audited Financial Results For The Year Ended 31.03.2026
18-May-2026 | Source : BSEPlease find enclosed herewith the following documents: 1. Independent Auditors Report for the year ended 31.03.2026. 2. Audited Financial Results for the quarter / year ended 31.03.2026. The above results were duly approved by the Audit Committee at their meeting held on 18.05.2026. The Board of Directors of the Company have recommended a dividend of 10% (Rs. 10/- per Equity Share of Rs. 100/- each).
Corporate Actions

No Upcoming Board Meetings

Lakshmi Mills Company Ltd has declared 9% dividend, ex-date: 14 Sep 23

No Splits history available

No Bonus history available

No Rights history available
Quality key factors
Valuation key factors
Technicals key factors
 Technical Indicator Scale: Bearish, Mildly Bearish, Sideways, Mildly Bullish, Bullish Turned
 Shareholding Snapshot : Dec 2025
Shareholding Compare (%holding)
Promoters
None
Held by 2 Schemes (0.0%)
Held by 1 FIIs (0.0%)
Pathy S (16.33%)
Lmw Limited (3.87%)
19.52%
Quarterly Results Snapshot (Standalone) - Mar'26 - QoQ

QoQ Growth in quarter ended Mar 2026 is 7.01% vs 5.58% in Dec 2025
QoQ Growth in quarter ended Mar 2026 is -5.88% vs -19.05% in Dec 2025
Half Yearly Results Snapshot (Standalone) - Sep'25

Growth in half year ended Sep 2025 is -17.12% vs 18.69% in Sep 2024
Growth in half year ended Sep 2025 is -12,906.67% vs 98.38% in Sep 2024
Nine Monthly Results Snapshot (Standalone) - Dec'25
YoY Growth in nine months ended Dec 2025 is -8.84% vs 3.88% in Dec 2024
YoY Growth in nine months ended Dec 2025 is -334.58% vs 66.47% in Dec 2024
Annual Results Snapshot (Standalone) - Mar'26
YoY Growth in year ended Mar 2026 is -8.11% vs 4.03% in Mar 2025
YoY Growth in year ended Mar 2026 is -232.26% vs 66.06% in Mar 2025
About Lakshmi Mills Company Ltd

Company Coordinates


