
Compare Lancor Holdings with Similar Stocks
Dashboard
With a Operating Losses, the company has a Weak Long Term Fundamental Strength
- Low ability to service debt as the company has a high Debt to EBITDA ratio of 106.61 times
- The company has been able to generate a Return on Equity (avg) of 4.86% signifying low profitability per unit of shareholders funds
Flat results in Mar 26
Risky - Negative Operating Profits
Total Returns (Price + Dividend) 
Latest dividend: 0.2 per share ex-dividend date: Sep-16-2025
Risk Adjusted Returns v/s
Returns Beta

News
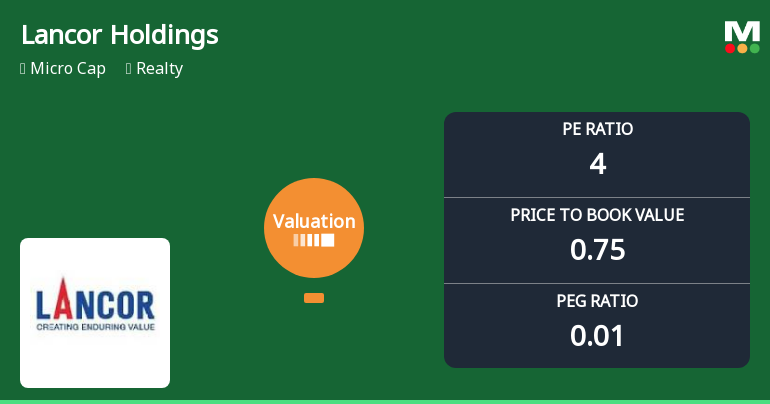
Valuation Shift Raises Concerns for Lancor Holdings Ltd Amid Mixed Market Returns
Lancor Holdings Ltd, a micro-cap player in the Realty sector, has seen a marked deterioration in its valuation parameters, prompting a downgrade in its Mojo Grade from Sell to Strong Sell as of 15 Apr 2026. This shift reflects growing concerns over the company’s price attractiveness, with key metrics such as the price-to-earnings (P/E) and price-to-book value (P/BV) ratios now signalling increased risk relative to historical and peer benchmarks.
Read full news article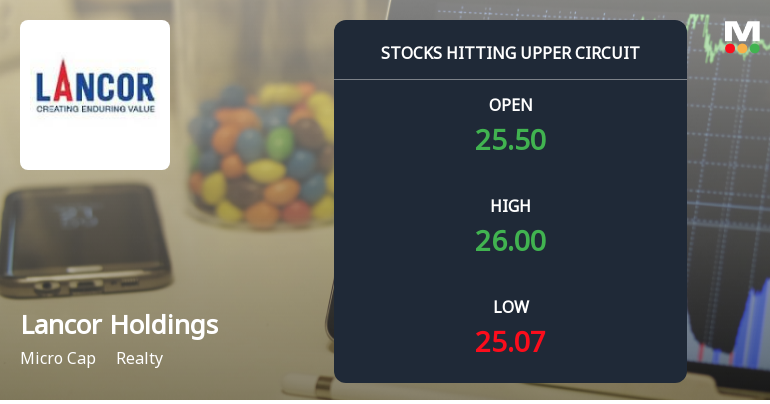
Lancor Holdings Ltd Locks at Upper Circuit With 4.92% Gain — Buyers Queue, Sellers Absent
At Rs 25.8, the buying was done — not because demand dried up, but because the exchange wouldn't let the stock go any higher. Lancor Holdings Ltd locked at its upper circuit of 4.92% on 1 Jun 2026, with buyers queuing and no sellers willing to part with shares.
Read full news article
Lancor Holdings Ltd is Rated Strong Sell
Lancor Holdings Ltd is rated Strong Sell by MarketsMOJO, with this rating last updated on 15 Apr 2026. However, the analysis and financial metrics discussed here reflect the stock’s current position as of 31 May 2026, providing investors with an up-to-date view of the company’s fundamentals, valuation, financial trends, and technical outlook.
Read full news article Announcements
Announcement under Regulation 30 (LODR)-Newspaper Publication
31-May-2026 | Source : BSENewspaper publication
Corporate Action-Board approves Dividend
29-May-2026 | Source : BSECorporate action- Board approves Dividend
Audited Financial Results For The Quarter And Year Ended March 31 2026
29-May-2026 | Source : BSEAudited Financial Result for the quarter and year ended March 31 2026
Corporate Actions

No Upcoming Board Meetings

Lancor Holdings Ltd has declared 10% dividend, ex-date: 16 Sep 25

Lancor Holdings Ltd has announced 2:10 stock split, ex-date: 26 Nov 07

Lancor Holdings Ltd has announced 1:2 bonus issue, ex-date: 18 Aug 23

No Rights history available
Quality key factors
Valuation key factors
Technicals key factors
 Technical Indicator Scale: Bearish, Mildly Bearish, Sideways, Mildly Bullish, Bullish Turned
 Shareholding Snapshot : Mar 2026
Shareholding Compare (%holding)
Promoters
None
Held by 0 Schemes
Held by 0 FIIs
Shekar Viswanath Rajamani (24.14%)
Sonia Gulati (2.83%)
36.47%
Quarterly Results Snapshot (Consolidated) - Mar'26 - QoQ

QoQ Growth in quarter ended Mar 2026 is -53.59% vs 14.01% in Dec 2025

QoQ Growth in quarter ended Mar 2026 is 22,757.89% vs 92.46% in Dec 2025
Half Yearly Results Snapshot (Consolidated) - Sep'25
Growth in half year ended Sep 2025 is -19.20% vs 46.63% in Sep 2024
Growth in half year ended Sep 2025 is -135.92% vs 171.66% in Sep 2024
Nine Monthly Results Snapshot (Consolidated) - Dec'25
YoY Growth in nine months ended Dec 2025 is -18.21% vs 46.87% in Dec 2024
YoY Growth in nine months ended Dec 2025 is -156.03% vs 23.73% in Dec 2024
Annual Results Snapshot (Consolidated) - Mar'26
YoY Growth in year ended Mar 2026 is -31.01% vs 37.58% in Mar 2025
YoY Growth in year ended Mar 2026 is 766.17% vs -30.81% in Mar 2025
About Lancor Holdings Ltd

Company Coordinates


