
Compare Last Mile Enter. with Similar Stocks
Stock DNA
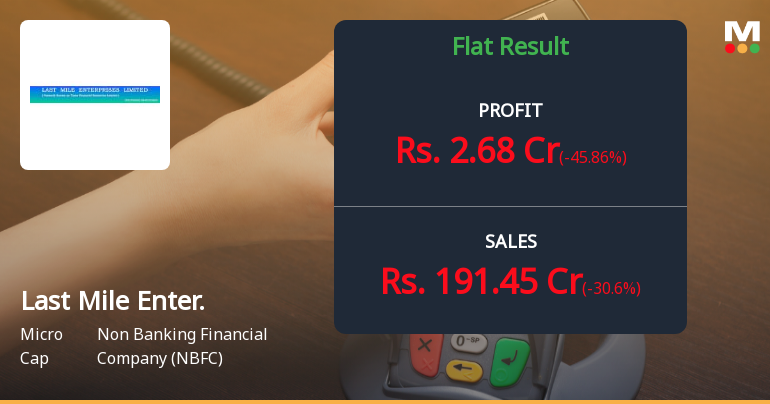
Non Banking Financial Company (NBFC)
INR 288 Cr (Micro Cap)
23.00
20
0.24%
0.07
3.06%
0.75
Total Returns (Price + Dividend) 
Latest dividend: 0.02 per share ex-dividend date: Sep-23-2025
Risk Adjusted Returns v/s
Returns Beta

News
Last Mile Enterprises Q4 FY26: Sharp Profit Decline Amid Revenue Volatility Raises Sustainability Concerns
Last Mile Enterprises Ltd. (formerly Trans Financial Resources Ltd.), a micro-cap non-banking financial company with a market capitalisation of ₹345.00 crores, reported a consolidated net profit of ₹2.68 crores for Q4 FY26, representing a year-on-year decline of 45.86% from ₹4.95 crores in Q4 FY25. The quarter-on-quarter performance showed a modest recovery with profits increasing 25.23% from ₹2.14 crores in Q3 FY26, though this follows a troubling pattern of sequential declines across the fiscal year.
Read full news article
Last Mile Enterprises Ltd is Rated Strong Sell
Last Mile Enterprises Ltd is rated Strong Sell by MarketsMOJO. This rating was last updated on 16 February 2026, reflecting a reassessment of the stock’s outlook. However, the analysis and financial metrics discussed below represent the company’s current position as of 01 June 2026, providing investors with the latest insights into its performance and prospects.
Read full news articleAre Last Mile Enterprises Ltd latest results good or bad?
The latest financial results for Last Mile Enterprises Ltd reveal a complex picture characterized by significant revenue growth but alarming declines in profitability. In the quarter ended December 2025, the company reported net sales of ₹375.02 crore, reflecting an extraordinary year-on-year growth of 424.06%. However, this figure represents a substantial sequential decline of 52.27% from the previous quarter, raising concerns about the sustainability and quality of this revenue growth. Conversely, the company's net profit for the same quarter was ₹2.14 crore, which marked a drastic year-on-year decline of 72.17%. This decline in profitability is further emphasized by the operating profit margin, which fell to 0.59% from 13.09% in the prior year, indicating severe pressure on the company's ability to convert sales into profit. The profit after tax (PAT) margin also compressed significantly, dropping to 0....
Read full news article Announcements
Announcement under Regulation 30 (LODR)-Newspaper Publication
08-Jun-2026 | Source : BSEPlease find enclosed herewith copy of advertisement given in newspaper of the Audited financial results for the quarter and year ended on March 31 2026.
Audited Financial Results For The Fourth Quarter And Year Ended March 31 2026
06-Jun-2026 | Source : BSEPusuant to Regulation 33 of the SEBI (LODR) Regulations 2015 please find enclosed the Audited Financial Results along with the Auditors Report for the fourth quarter and financial year ended March 31 2026.
Announcement under Regulation 30 (LODR)-Change in Management
06-Jun-2026 | Source : BSEPlease find the attached disclosure for appointment of Internal Auditor of the Company.
Corporate Actions

No Upcoming Board Meetings

Last Mile Enterprises Ltd has declared 2% dividend, ex-date: 23 Sep 25

Last Mile Enterprises Ltd has announced 1:10 stock split, ex-date: 21 Mar 25

No Bonus history available

No Rights history available
Quality key factors
Valuation key factors
Technicals key factors
 Technical Indicator Scale: Bearish, Mildly Bearish, Sideways, Mildly Bullish, Bullish Turned
 Shareholding Snapshot : Mar 2026
Shareholding Compare (%holding)
Non Institution
None
Held by 0 Schemes
Held by 14 FIIs (14.4%)
Siddharth Hans (9.37%)
Nav Capital Vcc - Nav Capital Emerging Star Fund (8.77%)
20.51%
Quarterly Results Snapshot (Consolidated) - Mar'26 - YoY

YoY Growth in quarter ended Mar 2026 is -30.60% vs 110.77% in Mar 2025
YoY Growth in quarter ended Mar 2026 is -45.86% vs 33.06% in Mar 2025
Half Yearly Results Snapshot (Consolidated) - Sep'25
Growth in half year ended Sep 2025 is 5,062.97% vs 27,928.57% in Sep 2024
Growth in half year ended Sep 2025 is 150.53% vs 443.37% in Sep 2024
Nine Monthly Results Snapshot (Consolidated) - Dec'25
YoY Growth in nine months ended Dec 2025 is 2,066.94% vs 79,042.86% in Dec 2024
YoY Growth in nine months ended Dec 2025 is -11.95% vs 917.05% in Dec 2024
Annual Results Snapshot (Consolidated) - Mar'26

YoY Growth in year ended Mar 2026 is 573.08% vs 193.97% in Mar 2025
YoY Growth in year ended Mar 2026 is -22.54% vs 535.39% in Mar 2025
About Last Mile Enterprises Ltd

Company Coordinates


