
Compare Latent View with Similar Stocks
Dashboard
Falling Participation by Institutional Investors
- Institutional investors have decreased their stake by -0.64% over the previous quarter and collectively hold 7.28% of the company
- These investors have better capability and resources to analyse fundamentals of companies than most retail investors
Underperformed the market in the last 1 year
Stock DNA
Computers - Software & Consulting
INR 6,303 Cr (Small Cap)
32.00
20
0.00%
-0.35
11.29%
3.54
Total Returns (Price + Dividend) 
Latent View for the last several years.
Risk Adjusted Returns v/s
Returns Beta

News

Latent View Analytics Ltd is Rated Sell
Latent View Analytics Ltd is rated 'Sell' by MarketsMOJO, with this rating last updated on 20 February 2026. However, the analysis and financial metrics discussed here reflect the stock's current position as of 13 June 2026, providing investors with an up-to-date perspective on the company’s performance and outlook.
Read full news article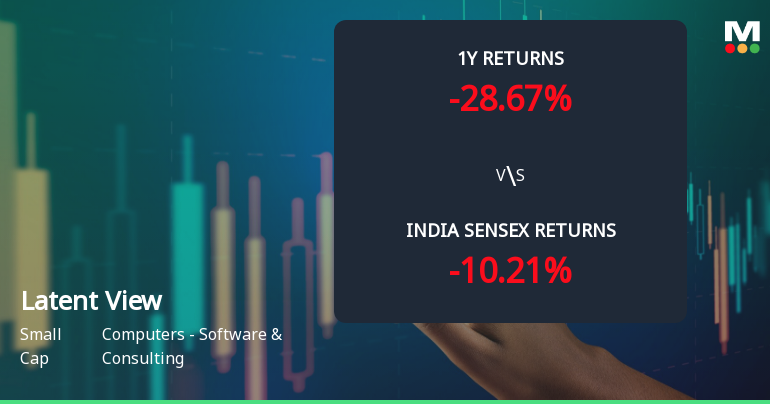
Latent View Analytics Ltd Faces Bearish Momentum Amid Technical Downgrade
Latent View Analytics Ltd, a small-cap player in the Computers - Software & Consulting sector, has experienced a notable shift in price momentum and technical indicators, signalling a bearish trend. The stock’s recent performance contrasts sharply with broader market indices, reflecting mounting pressure from technical parameters and investor sentiment.
Read full news article
Latent View Analytics Ltd is Rated Sell
Latent View Analytics Ltd is rated Sell by MarketsMOJO. This rating was last updated on 20 Feb 2026, reflecting a reassessment of the stock’s outlook. However, all fundamentals, returns, and financial metrics discussed below are current as of 02 June 2026, providing investors with the latest perspective on the company’s position.
Read full news article Announcements
Announcement under Regulation 30 (LODR)-Analyst / Investor Meet - Intimation
09-Jun-2026 | Source : BSEPursuant to Regulation 30 of SEBI (Listing Obligations and Disclosure Requirements) Regulations 2015 please be informed of the schedule of Analysts /Institutional Investor meeting with the Company.
Announcement under Regulation 30 (LODR)-Earnings Call Transcript
25-May-2026 | Source : BSEPursuant to Regulation 30 of SEBI (Listing Obligations and Disclosure Requirements) Regulations 2015 please find enclosed the transcript of the Earnings Call held on Monday May 18 2026 post announcement of financial results of the company for the quarter and financial year ended March 31 2026.
Announcement under Regulation 30 (LODR)-Newspaper Publication
18-May-2026 | Source : BSEPursuant to Regulation 47 of SEBI (Listing Obligations and Disclosure Requirements) Regulations 2015 we have enclosed herewith a copy of the newspaper advertisements published in Makkal Kural on May 17 2026 and in Mint on May 18 2026.
Corporate Actions

No Upcoming Board Meetings

No Dividend history available

No Splits history available

No Bonus history available

No Rights history available
Quality key factors
Valuation key factors
Technicals key factors
 Technical Indicator Scale: Bearish, Mildly Bearish, Sideways, Mildly Bullish, Bullish Turned
 Shareholding Snapshot : Mar 2026
Shareholding Compare (%holding)
Promoters
None
Held by 22 Schemes (3.67%)
Held by 61 FIIs (3.15%)
Adugudi Viswanathan Venkatraman (56.98%)
Gopinath Koteeswaran (4.58%)
23.43%
Quarterly Results Snapshot (Consolidated) - Mar'26 - QoQ

QoQ Growth in quarter ended Mar 2026 is 3.82% vs 7.95% in Dec 2025
QoQ Growth in quarter ended Mar 2026 is 5.21% vs 12.95% in Dec 2025
Half Yearly Results Snapshot (Consolidated) - Sep'25
Growth in half year ended Sep 2025 is 27.26% vs 27.84% in Sep 2024

Growth in half year ended Sep 2025 is 20.83% vs 17.84% in Sep 2024
Nine Monthly Results Snapshot (Consolidated) - Dec'25
YoY Growth in nine months ended Dec 2025 is 25.32% vs 31.26% in Dec 2024
YoY Growth in nine months ended Dec 2025 is 20.43% vs 6.45% in Dec 2024
Annual Results Snapshot (Consolidated) - Mar'26
YoY Growth in year ended Mar 2026 is 25.05% vs 32.33% in Mar 2025
YoY Growth in year ended Mar 2026 is 13.74% vs 9.80% in Mar 2025
About Latent View Analytics Ltd

Company Coordinates


