
Compare Le Travenues with Similar Stocks
Dashboard
With ROE of 3.6, it has a Very Expensive valuation with a 4 Price to Book Value
- The stock is trading at a premium compared to its peers' average historical valuations
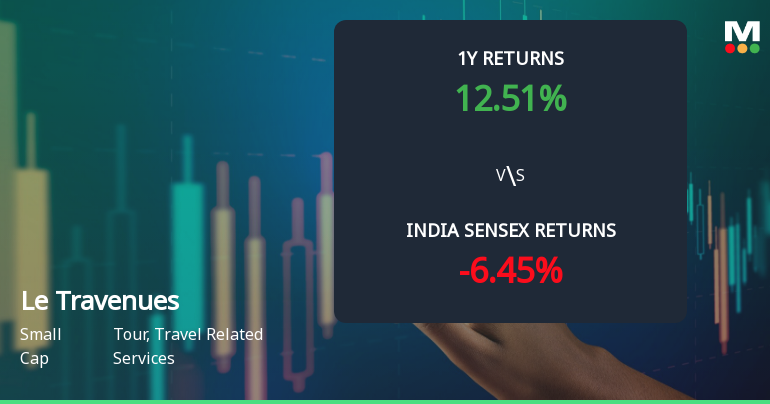
- Over the past year, while the stock has generated a return of 11.53%, its profits have risen by 31.4% ; the PEG ratio of the company is 6.6
Stock DNA
Tour, Travel Related Services
INR 8,632 Cr (Small Cap)
112.00
36
0.00%
-0.45
3.63%
4.16
Total Returns (Price + Dividend) 
Le Travenues for the last several years.
Risk Adjusted Returns v/s
Returns Beta

News
Le Travenues Technology Ltd Technical Momentum Shifts Amid Mixed Market Signals
Le Travenues Technology Ltd, a small-cap player in the Tour and Travel Related Services sector, has experienced a notable shift in its technical momentum, moving from a mildly bullish stance to a sideways trend. Despite a recent day gain of 2.13%, the stock’s technical indicators present a complex picture, reflecting both cautious optimism and emerging bearish signals.
Read full news article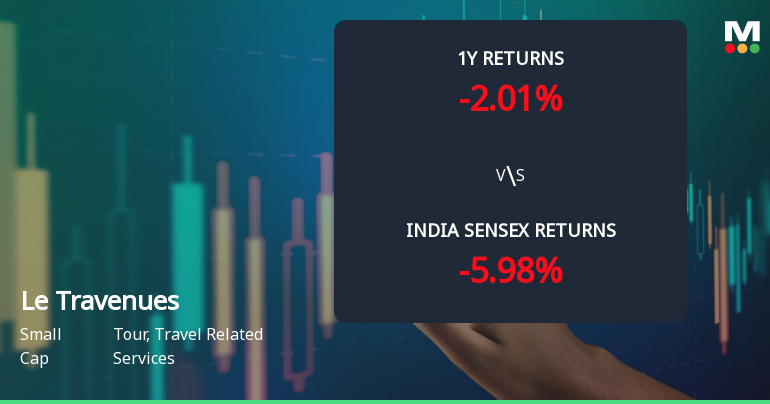
Le Travenues Technology Ltd Shows Signs of Technical Rebound Amid Mixed Returns
Le Travenues Technology Ltd, a small-cap player in the Tour and Travel Related Services sector, has recently exhibited a notable shift in its technical momentum, moving from a mildly bearish stance to a mildly bullish outlook. Despite a challenging year-to-date return of -28.23%, the stock’s recent price action and technical indicators suggest a potential turnaround, warranting close attention from investors and market analysts alike.
Read full news article
Le Travenues Technology Ltd is Rated Sell
Le Travenues Technology Ltd is rated 'Sell' by MarketsMOJO, with this rating last updated on 11 February 2026. However, the analysis and financial metrics discussed here reflect the stock's current position as of 13 June 2026, providing investors with an up-to-date view of the company’s fundamentals, valuation, financial trends, and technical outlook.
Read full news article Announcements
Closure of Trading Window
22-Jun-2026 | Source : BSEClosure of Trading Window from Tuesday June 30 2026 for all designated persons along with their immediate relatives
Investor Faqs - Acquisition Of Brevistay Hospitality Private Limited
07-Jun-2026 | Source : BSEInvestor FAQs on Acquisition of Brevistay Hospitality Private Limited
Board Meeting Outcome for Outcome Of The Board Meeting Held On June 05 2026
05-Jun-2026 | Source : BSEAnnouncement under Regulation 30 and other applicable provisions of the SEBI (Listing Obligations and Disclosure Requirements) Regulations 2015 - Outcome of the Board Meeting
Corporate Actions

No Upcoming Board Meetings

No Dividend history available

No Splits history available

No Bonus history available

No Rights history available
Quality key factors
Valuation key factors
Technicals key factors
 Technical Indicator Scale: Bearish, Mildly Bearish, Sideways, Mildly Bullish, Bullish Turned
 Shareholding Snapshot : Mar 2026
Shareholding Compare (%holding)
FIIs
None
Held by 11 Schemes (5.78%)
Held by 124 FIIs (64.19%)
None
Mih Investments One B.v. (16.18%)
6.79%
Quarterly Results Snapshot (Consolidated) - Mar'26 - QoQ

QoQ Growth in quarter ended Mar 2026 is -3.64% vs 13.07% in Dec 2025
QoQ Growth in quarter ended Mar 2026 is 31.74% vs 862.89% in Dec 2025
Half Yearly Results Snapshot (Consolidated) - Sep'25

Growth in half year ended Sep 2025 is 53.78% vs 21.18% in Sep 2024
Growth in half year ended Sep 2025 is -43.06% vs -23.87% in Sep 2024
Nine Monthly Results Snapshot (Consolidated) - Dec'25
YoY Growth in nine months ended Dec 2025 is 45.52% vs 28.33% in Dec 2024
YoY Growth in nine months ended Dec 2025 is -7.57% vs -34.94% in Dec 2024
Annual Results Snapshot (Consolidated) - Mar'26
YoY Growth in year ended Mar 2026 is 34.32% vs 39.40% in Mar 2025
YoY Growth in year ended Mar 2026 is 19.86% vs -20.61% in Mar 2025
About Le Travenues Technology Ltd

Company Coordinates


