
Compare Lincoln Pharma. with Similar Stocks
Dashboard
The company is Net-Debt Free
Poor long term growth as Net Sales has grown by an annual rate of 9.61% and Operating profit at 0.88% over the last 5 years
Flat results in Mar 26
With ROE of 11.6, it has a Attractive valuation with a 1.6 Price to Book Value
Increasing Participation by Institutional Investors
Market Beating performance in long term as well as near term
Stock DNA
Pharmaceuticals & Biotechnology
INR 1,238 Cr (Micro Cap)
14.00
36
0.30%
-0.31
11.60%
1.61
Total Returns (Price + Dividend) 
Latest dividend: 1.8 per share ex-dividend date: Sep-12-2025
Risk Adjusted Returns v/s
Returns Beta

News
Lincoln Pharmaceuticals Ltd is Rated Hold
Lincoln Pharmaceuticals Ltd is rated 'Hold' by MarketsMOJO, with this rating last updated on 16 Mar 2026. However, the analysis and financial metrics discussed here reflect the stock's current position as of 05 July 2026, providing investors with an up-to-date view of its fundamentals, returns, and market performance.
Read full news article
Lincoln Pharmaceuticals Ltd is Rated Hold
Lincoln Pharmaceuticals Ltd is rated 'Hold' by MarketsMOJO, with this rating last updated on 16 Mar 2026. However, the analysis and financial metrics discussed here reflect the stock's current position as of 24 June 2026, providing investors with an up-to-date view of the company’s fundamentals, returns, and market performance.
Read full news article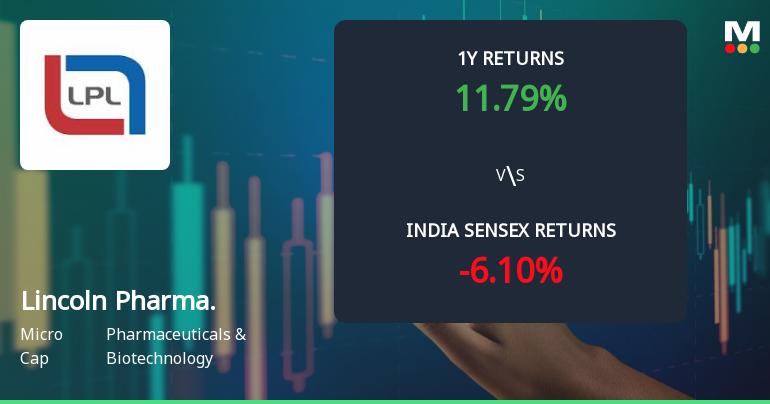
Lincoln Pharmaceuticals Ltd Technical Momentum Shifts Amid Mixed Indicator Signals
Lincoln Pharmaceuticals Ltd has experienced a nuanced shift in its technical momentum, with key indicators signalling a transition from bullish to mildly bullish territory. Despite a slight dip in daily price, the stock’s longer-term technicals and fundamental returns continue to present a complex but cautiously optimistic outlook for investors in the Pharmaceuticals & Biotechnology sector.
Read full news article Announcements
Lincoln Pharmaceuticals Limited - Outcome of Board Meeting
09-Dec-2019 | Source : NSELincoln Pharmaceuticals Limited has informed the Exchange regarding Board meeting held on December 07, 2019 for consider and approved draft scheme of amalgamation and withdrawal scheme approved by Board earlier
Lincoln Pharmaceuticals Limited - Outcome of Board Meeting
14-Nov-2019 | Source : NSELincoln Pharmaceuticals Limited has informed the Exchange regarding Board meeting held on November 14, 2019 for Considered and Approved Un-Audited Standalone and Consolidated Financial Results for the Quarter and Half Year Ended on September 30, 2019
Lincoln Pharmaceuticals Limited - Press Release
22-Oct-2019 | Source : NSELincoln Pharmaceuticals Limited has informed the Exchange regarding a press release dated October 22, 2019, titled "press release dated October 22, 2019 titled "Lincoln Pharmaceuticals Limited receives a Patent for Diclofenac Rectal Spray. ".
Corporate Actions

No Upcoming Board Meetings

Lincoln Pharmaceuticals Ltd has declared 18% dividend, ex-date: 12 Sep 25

Lincoln Pharmaceuticals Ltd has announced 10:2 stock split, ex-date: 19 Mar 09

No Bonus history available

No Rights history available
Quality key factors
Valuation key factors
Technicals key factors
 Technical Indicator Scale: Bearish, Mildly Bearish, Sideways, Mildly Bullish, Bullish Turned
 Shareholding Snapshot : Mar 2026
Shareholding Compare (%holding)
Promoters
None
Held by 2 Schemes (0.0%)
Held by 43 FIIs (5.19%)
Munjal Mahendrabhai Patel (13.37%)
Kishor M. Shah (2.39%)
34.7%
Quarterly Results Snapshot (Consolidated) - Mar'26 - YoY

YoY Growth in quarter ended Mar 2026 is 11.36% vs 18.03% in Mar 2025

YoY Growth in quarter ended Mar 2026 is 0.43% vs -37.74% in Mar 2025
Half Yearly Results Snapshot (Consolidated) - Sep'25
Growth in half year ended Sep 2025 is 2.89% vs 5.79% in Sep 2024
Growth in half year ended Sep 2025 is -4.68% vs 7.14% in Sep 2024
Nine Monthly Results Snapshot (Consolidated) - Dec'25
YoY Growth in nine months ended Dec 2025 is 6.31% vs 3.88% in Dec 2024
YoY Growth in nine months ended Dec 2025 is 7.76% vs -5.27% in Dec 2024
Annual Results Snapshot (Consolidated) - Mar'26
YoY Growth in year ended Mar 2026 is 7.67% vs 7.35% in Mar 2025
YoY Growth in year ended Mar 2026 is 6.73% vs -11.74% in Mar 2025
About Lincoln Pharmaceuticals Ltd

Company Coordinates


