
Compare LKP Finance with Similar Stocks
Stock DNA
Non Banking Financial Company (NBFC)
INR 1,577 Cr (Micro Cap)
NA (Loss Making)
21
0.00%
0.10
-0.10%
4.44
Total Returns (Price + Dividend) 
Latest dividend: 3 per share ex-dividend date: Nov-10-2023
Risk Adjusted Returns v/s
Returns Beta

News

LKP Finance Ltd Technical Momentum Shifts Amid Mixed Market Signals
LKP Finance Ltd, a micro-cap player in the Non Banking Financial Company (NBFC) sector, has experienced a notable shift in its technical momentum, moving from a mildly bullish stance to a more confident bullish trend. Despite a recent day decline of 1.59%, the stock’s technical indicators reveal a complex interplay of signals that investors should carefully analyse to gauge future price action.
Read full news article
LKP Finance Ltd is Rated Sell
LKP Finance Ltd is rated 'Sell' by MarketsMOJO, with this rating last updated on 10 Feb 2026. However, the analysis and financial metrics discussed here reflect the stock's current position as of 01 May 2026, providing investors with the latest insights into the company’s performance and outlook.
Read full news article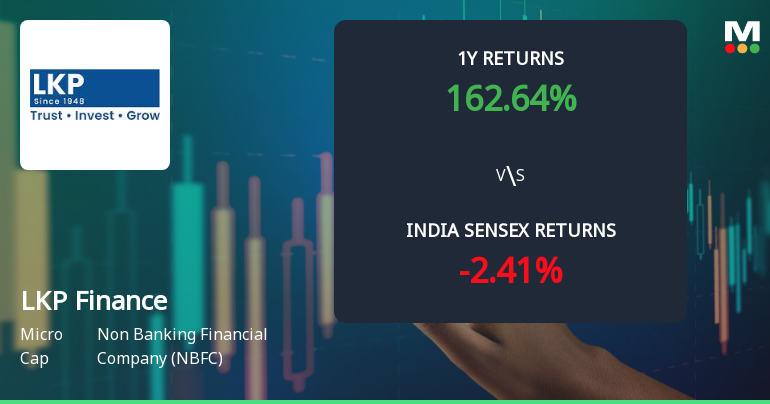
LKP Finance Ltd Technical Momentum Shifts Amid Mixed Indicator Signals
LKP Finance Ltd, a micro-cap player in the Non Banking Financial Company (NBFC) sector, has experienced a nuanced shift in its technical momentum, reflecting a complex interplay of bullish and bearish signals across key indicators. Despite a recent downgrade from Hold to Sell by MarketsMOJO on 10 February 2026, the stock’s price action and technical parameters reveal a cautiously optimistic outlook tempered by pockets of weakness.
Read full news article Announcements
Shareholder Meeting / Postal Ballot-Outcome of Postal_Ballot
27-Apr-2026 | Source : BSEOutcome of Postal Ballot.
Shareholder Meeting / Postal Ballot-Scrutinizers Report
27-Apr-2026 | Source : BSEPostal Ballot-Scrutinizer Report along with Voting Result.
Announcement under Regulation 30 (LODR)-Newspaper Publication
13-Apr-2026 | Source : BSEAnnouncement under Regulation 30 (LODR)- Newspaper Publication
Corporate Actions

No Upcoming Board Meetings

LKP Finance Ltd has declared 30% dividend, ex-date: 10 Nov 23

No Splits history available

LKP Finance Ltd has announced 4:1 bonus issue, ex-date: 06 Mar 26

LKP Finance Ltd has announced 6:27 rights issue, ex-date: 11 Sep 25
Quality key factors
Valuation key factors
Technicals key factors
 Technical Indicator Scale: Bearish, Mildly Bearish, Sideways, Mildly Bullish, Bullish Turned
 Shareholding Snapshot : Mar 2026
Shareholding Compare (%holding)
Promoters
None
Held by 0 Schemes
Held by 5 FIIs (4.43%)
Hindon Mercantile Limited (49.97%)
Siddharth Iyer (3.5%)
15.32%
Quarterly Results Snapshot (Consolidated) - Dec'25 - QoQ
Not Applicable: The company has declared_date for only one period
Not Applicable: The company has declared_date for only one period
Half Yearly Results Snapshot (Standalone) - Sep'25

Growth in half year ended Sep 2025 is -90.78% vs -15.13% in Sep 2024
Growth in half year ended Sep 2025 is -65.65% vs -10.43% in Sep 2024
Nine Monthly Results Snapshot (Standalone) - Dec'25
YoY Growth in nine months ended Dec 2025 is -110.36% vs -64.26% in Dec 2024

YoY Growth in nine months ended Dec 2025 is -7.30% vs -63.69% in Dec 2024
Annual Results Snapshot (Consolidated) - Mar'25
YoY Growth in year ended Mar 2025 is -84.27% vs 219.55% in Mar 2024
YoY Growth in year ended Mar 2025 is -96.94% vs 328.62% in Mar 2024
About LKP Finance Ltd

Company Coordinates


