
Compare Lloyds Metals with Similar Stocks
Dashboard
Strong Long Term Fundamental Strength with an average Return on Equity (ROE) of 37.65%
- Healthy long term growth as Net Sales has grown by an annual rate of 132.22% and Operating profit at 351.27%
- Strong ability to service debt as the company has a low Debt to EBITDA ratio of 3.10 times
With a growth in Operating Profit of 811.87%, the company declared Outstanding results in Mar 26
Majority shareholders : Promoters
Company is among the highest 1% of companies rated by MarketsMojo across all 4,000 stocks
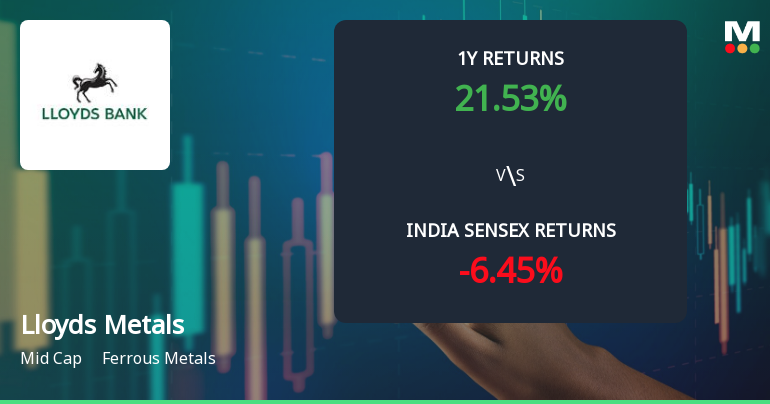
Consistent Returns over the last 3 years
Stock DNA
Ferrous Metals
INR 100,097 Cr (Mid Cap)
27.00
26
0.06%
0.94
13.01%
7.23
Total Returns (Price + Dividend) 
Latest dividend: 1 per share ex-dividend date: Jun-12-2026
Risk Adjusted Returns v/s
Returns Beta

News
Lloyds Metals & Energy Ltd Technical Momentum Shifts Signal Bullish Outlook
Lloyds Metals & Energy Ltd has demonstrated a significant shift in price momentum, supported by a robust set of technical indicators signalling a bullish trend. With a recent upgrade to a Strong Buy rating and a Mojo Score of 90.0, the mid-cap ferrous metals company is attracting renewed investor interest amid improving market dynamics and positive technical momentum.
Read full news article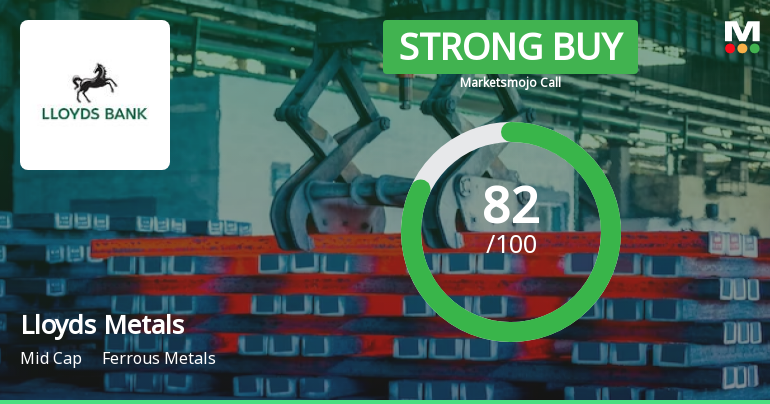
Lloyds Metals & Energy Ltd is Rated Strong Buy
Lloyds Metals & Energy Ltd is rated Strong Buy by MarketsMOJO, with this rating last updated on 27 April 2026. However, the analysis and financial metrics discussed here reflect the company’s current position as of 22 June 2026, providing investors with the latest insights into its performance and outlook.
Read full news article
Lloyds Metals & Energy Ltd Technical Momentum Shifts Signal Cautious Optimism
Lloyds Metals & Energy Ltd has witnessed a nuanced shift in its technical momentum, prompting an upgrade to a Strong Buy rating with a Mojo Score of 82.0. Despite a marginal day decline of 0.09%, the stock’s technical indicators reveal a predominantly bullish outlook, supported by robust moving averages and positive MACD signals, while some oscillators suggest caution. This detailed analysis explores the evolving technical landscape and what it means for investors amid a strong long-term performance versus the Sensex.
Read full news article Announcements
Shareholder Meeting / Postal Ballot-Scrutinizers Report
20-Jun-2026 | Source : BSEScrutinizers Report and Result of E-Voting of the 49th Annual General Meeting of the Company held through Video Conferencing & Other Audio Visual Means on Friday 19th June 2026.
Disclosures under Reg. 31(1) and 31(2) of SEBI (SAST) Regulations 2011.
20-Jun-2026 | Source : BSEThe Exchange has received Disclosure under Regulation 31(1) and 31(2) of SEBI (Substantial Acquisition of Shares & Takeovers) Regulations 2011 on June 20 2026 for Thriveni Earthmovers Pvt Ltd
Disclosures under Reg. 31(1) and 31(2) of SEBI (SAST) Regulations 2011.
19-Jun-2026 | Source : BSEThe Exchange has received Disclosure under Regulation 31(1) and 31(2) of SEBI (Substantial Acquisition of Shares & Takeovers) Regulations 2011 on June 18 2026 for Crosslink Food and Farms Pvt Ltd
Corporate Actions

No Upcoming Board Meetings

Lloyds Metals & Energy Ltd has declared 100% dividend, ex-date: 12 Jun 26

Lloyds Metals & Energy Ltd has announced 1:2 stock split, ex-date: 26 Jul 16

No Bonus history available

No Rights history available
Quality key factors
Valuation key factors
Technicals key factors
 Technical Indicator Scale: Bearish, Mildly Bearish, Sideways, Mildly Bullish, Bullish Turned
 Shareholding Snapshot : Mar 2026
Shareholding Compare (%holding)
Promoters
5.1686
Held by 78 Schemes (1.63%)
Held by 129 FIIs (2.23%)
Thriveni Earthmovers Private Limited (17.77%)
Sunflag Iron And Steel Company Limited (10.66%)
11.93%
Quarterly Results Snapshot (Consolidated) - Mar'26 - YoY

YoY Growth in quarter ended Mar 2026 is 404.46% vs -23.23% in Mar 2025
YoY Growth in quarter ended Mar 2026 is 603.14% vs -27.10% in Mar 2025
Half Yearly Results Snapshot (Consolidated) - Sep'25
Growth in half year ended Sep 2025 is 59.58% vs 23.71% in Sep 2024
Growth in half year ended Sep 2025 is 41.37% vs 35.34% in Sep 2024
Nine Monthly Results Snapshot (Consolidated) - Dec'25
YoY Growth in nine months ended Dec 2025 is 103.29% vs 9.81% in Dec 2024
YoY Growth in nine months ended Dec 2025 is 81.20% vs 29.19% in Dec 2024
Annual Results Snapshot (Consolidated) - Mar'26
YoY Growth in year ended Mar 2026 is 154.61% vs 3.01% in Mar 2025
YoY Growth in year ended Mar 2026 is 152.94% vs 17.08% in Mar 2025
About Lloyds Metals & Energy Ltd

Company Coordinates


