
Compare Lorenzini Appar. with Similar Stocks
Dashboard
High Management Efficiency with a high ROE of 15.41%
Strong ability to service debt as the company has a low Debt to EBITDA ratio of 2.77 times
Poor long term growth as Operating profit has grown by an annual rate -7.76% of over the last 5 years
With a growth in Net Sales of 85.06%, the company declared Very Positive results in Mar 26
With ROCE of 8.8, it has a Fair valuation with a 2.5 Enterprise value to Capital Employed
Falling Participation by Institutional Investors
Stock DNA
Garments & Apparels
INR 151 Cr (Micro Cap)
34.00
26
0.00%
0.26
8.36%
2.94
Total Returns (Price + Dividend) 
Lorenzini Appar. for the last several years.
Risk Adjusted Returns v/s
Returns Beta

News

Lorenzini Apparels Ltd is Rated Hold by MarketsMOJO
Lorenzini Apparels Ltd is rated 'Hold' by MarketsMOJO, with this rating last updated on 01 June 2026. However, the analysis and financial metrics discussed here reflect the stock's current position as of 08 July 2026, providing investors with an up-to-date view of the company’s fundamentals, returns, and market standing.
Read full news article
Lorenzini Apparels Ltd is Rated Hold by MarketsMOJO
Lorenzini Apparels Ltd is rated 'Hold' by MarketsMOJO, with this rating last updated on 01 June 2026. However, the analysis and financial metrics discussed here reflect the company’s current position as of 27 June 2026, providing investors with an up-to-date view of the stock’s fundamentals, returns, and overall outlook.
Read full news article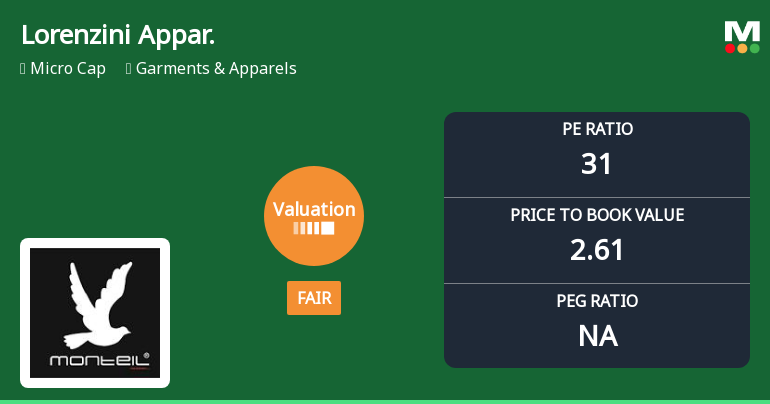
Lorenzini Apparels Ltd Valuation Shifts: From Attractive to Fair Amidst Mixed Market Returns
Lorenzini Apparels Ltd, a micro-cap player in the Garments & Apparels sector, has recently experienced a notable shift in its valuation parameters, moving from an attractive to a fair valuation grade. This change reflects evolving market perceptions amid fluctuating price-to-earnings (P/E) and price-to-book value (P/BV) ratios, prompting investors to reassess the stock’s price attractiveness relative to its historical levels and peer group.
Read full news article Announcements
Compliances-Certificate under Reg. 74 (5) of SEBI (DP) Regulations 2018
07-Jul-2026 | Source : BSERTAs Certificate in terms of Regulation 74(5) of SEBI ( Depositories and Participants) Regulations 2018 for the Quarter ended on June 30th 2026.
Closure of Trading Window
24-Jun-2026 | Source : BSEThe window for trading in the shares of the company shall remain close from 1st july 2026 till the completion of 48 hours after the declaration of the Unaudited financial result for the quarter ended 30th june 2026.
Announcement under Regulation 30 (LODR)-Newspaper Publication
29-May-2026 | Source : BSESubmission of newspaper advertisement pertaining to audited financial Statement for the quarter and financial year ended on 31st March 2026.
Corporate Actions

No Upcoming Board Meetings

No Dividend history available

Lorenzini Apparels Ltd has announced 1:10 stock split, ex-date: 28 Mar 24

Lorenzini Apparels Ltd has announced 6:11 bonus issue, ex-date: 28 Mar 24

No Rights history available
Quality key factors
Valuation key factors
Technicals key factors
 Technical Indicator Scale: Bearish, Mildly Bearish, Sideways, Mildly Bullish, Bullish Turned
 Shareholding Snapshot : Jun 2026
Shareholding Compare (%holding)
Promoters
None
Held by 0 Schemes
Held by 3 FIIs (0.41%)
Sandeep Jain (52.41%)
Anshul Singh (4.8%)
27.61%
Quarterly Results Snapshot (Standalone) - Mar'26 - YoY

YoY Growth in quarter ended Mar 2026 is 85.06% vs 39.62% in Mar 2025
YoY Growth in quarter ended Mar 2026 is 113.24% vs -2,153.12% in Mar 2025
Half Yearly Results Snapshot (Standalone) - Sep'25
Growth in half year ended Sep 2025 is -6.98% vs -12.08% in Sep 2024

Growth in half year ended Sep 2025 is -83.04% vs 437.55% in Sep 2024
Nine Monthly Results Snapshot (Standalone) - Dec'25
YoY Growth in nine months ended Dec 2025 is -5.07% vs 10.52% in Dec 2024
YoY Growth in nine months ended Dec 2025 is -71.96% vs 149.20% in Dec 2024
Annual Results Snapshot (Standalone) - Mar'26
YoY Growth in year ended Mar 2026 is 14.71% vs 15.81% in Mar 2025
YoY Growth in year ended Mar 2026 is -25.51% vs 10.19% in Mar 2025
About Lorenzini Apparels Ltd

Company Coordinates


