
Compare Lovable Lingerie with Similar Stocks
Dashboard
With a Operating Losses, the company has a Weak Long Term Fundamental Strength
- Company's ability to service its debt is weak with a poor EBIT to Interest (avg) ratio of -4.62
- The company has been able to generate a Return on Equity (avg) of 2.39% signifying low profitability per unit of shareholders funds
Risky - Negative EBITDA
Consistent Underperformance against the benchmark over the last 3 years
Stock DNA
Garments & Apparels
INR 108 Cr (Micro Cap)
14.00
43
0.00%
0.01
4.60%
0.65
Total Returns (Price + Dividend) 
Latest dividend: 0.503416149068323 per share ex-dividend date: Sep-21-2022
Risk Adjusted Returns v/s
Returns Beta

News

Lovable Lingerie Ltd is Rated Strong Sell
Lovable Lingerie Ltd is rated Strong Sell by MarketsMOJO, with this rating last updated on 01 April 2024. However, the analysis and financial metrics discussed here reflect the company’s current position as of 16 June 2026, providing investors with the latest insights into its performance and outlook.
Read full news article
Lovable Lingerie Ltd is Rated Strong Sell
Lovable Lingerie Ltd is rated Strong Sell by MarketsMOJO, with this rating last updated on 01 April 2024. However, the analysis and financial metrics discussed here reflect the company’s current position as of 02 June 2026, providing investors with an up-to-date view of the stock’s fundamentals, valuation, financial trends, and technical outlook.
Read full news article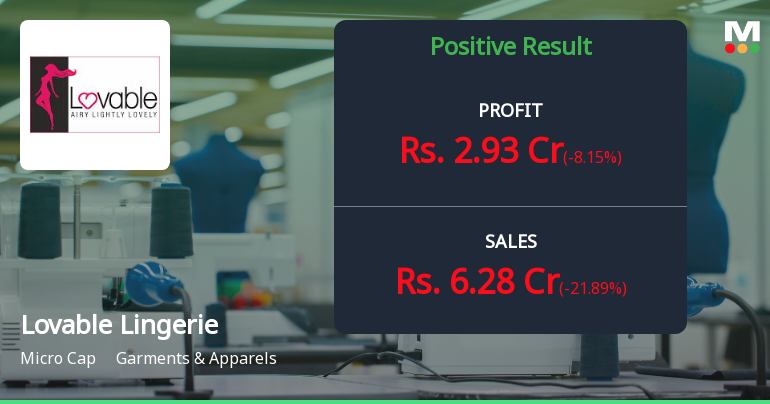
Lovable Lingerie Q4 FY26: Profitability Mirage Masks Deepening Operational Crisis
Lovable Lingerie Ltd., the Mumbai-based garment manufacturer, reported a net profit of ₹3.96 crores for Q4 FY26, representing a 46.71% sequential increase from ₹2.70 crores in Q3 FY26 and a 24.14% year-on-year improvement from ₹3.19 crores in Q4 FY25. However, this apparent profitability gain is entirely attributable to an extraordinary tax credit of ₹6.60 crores, masking a deteriorating operational performance that saw revenues collapse by 40.36% quarter-on-quarter to just ₹6.28 crores—the lowest quarterly sales figure in recent history. The stock, currently trading at ₹73.16 with a market capitalisation of ₹108.00 crores, has declined 27.92% over the past year, significantly underperforming the Sensex's 8.40% decline and reflecting investor concerns about the company's fundamental health.
Read full news article Announcements
Announcement under Regulation 30 (LODR)-Newspaper Publication
01-Jun-2026 | Source : BSEnewspaper Publication of Audited Financial Results for the Fourth Quarter and year ended 31st march 2026
Compliances-Reg.24(A)-Annual Secretarial Compliance
30-May-2026 | Source : BSEAnnual Secretarial Compliance Report for the financial year ended on 31st March 2026
Audited Financial Results For Quarter And Financial Year Ended On 31St March 2026
29-May-2026 | Source : BSEOutcome of Board meeting held on 29th May 2026 for approval of audited financial results
Corporate Actions

No Upcoming Board Meetings

Lovable Lingerie Ltd has declared 5% dividend, ex-date: 21 Sep 22

No Splits history available

No Bonus history available

No Rights history available
Quality key factors
Valuation key factors
Technicals key factors
 Technical Indicator Scale: Bearish, Mildly Bearish, Sideways, Mildly Bullish, Bullish Turned
 Shareholding Snapshot : Mar 2026
Shareholding Compare (%holding)
Promoters
None
Held by 0 Schemes
Held by 1 FIIs (0.0%)
Vinay Jaipal Reddy (27.95%)
None
31.76%
Quarterly Results Snapshot (Standalone) - Mar'26 - YoY

YoY Growth in quarter ended Mar 2026 is -21.89% vs 45.92% in Mar 2025
YoY Growth in quarter ended Mar 2026 is -8.15% vs 272.43% in Mar 2025
Half Yearly Results Snapshot (Standalone) - Sep'25

Growth in half year ended Sep 2025 is -1.74% vs -44.79% in Sep 2024
Growth in half year ended Sep 2025 is -136.23% vs -91.83% in Sep 2024
Nine Monthly Results Snapshot (Standalone) - Dec'25
YoY Growth in nine months ended Dec 2025 is 5.10% vs -41.37% in Dec 2024
YoY Growth in nine months ended Dec 2025 is 114.80% vs -125.49% in Dec 2024
Annual Results Snapshot (Standalone) - Mar'26
YoY Growth in year ended Mar 2026 is -0.05% vs -33.83% in Mar 2025
YoY Growth in year ended Mar 2026 is 87.15% vs -58.18% in Mar 2025
About Lovable Lingerie Ltd

Company Coordinates


