
Compare Lux Industries with Similar Stocks
Dashboard
Company has a Debt to Equity ratio (avg) of 0.10 times
Poor long term growth as Operating profit has grown by an annual rate -16.26% of over the last 5 years
The company has declared Negative results for the last 4 consecutive quarters
With ROCE of 6.8, it has a Very Attractive valuation with a 1.9 Enterprise value to Capital Employed
Despite the size of the company, domestic mutual funds hold only 0% of the company
Consistent Underperformance against the benchmark over the last 3 years
Stock DNA
Garments & Apparels
INR 3,943 Cr (Small Cap)
36.00
24
0.16%
0.20
5.88%
2.09
Total Returns (Price + Dividend) 
Latest dividend: 2 per share ex-dividend date: Sep-15-2025
Risk Adjusted Returns v/s
Returns Beta

News

Lux Industries Ltd is Rated Hold
Lux Industries Ltd is rated 'Hold' by MarketsMOJO, with this rating last updated on 21 May 2026. However, the analysis and financial metrics discussed here reflect the stock's current position as of 12 June 2026, providing investors with an up-to-date view of the company’s fundamentals, valuation, financial trends, and technical outlook.
Read full news article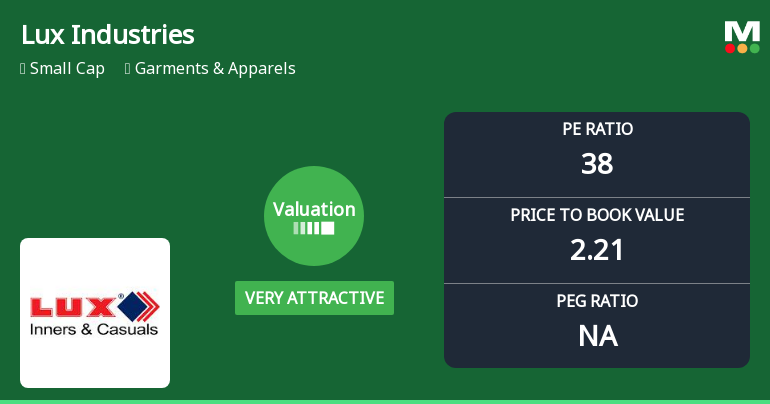
Lux Industries Ltd Valuation Shifts to Very Attractive Amid Mixed Market Returns
Lux Industries Ltd, a key player in the Garments & Apparels sector, has seen a notable shift in its valuation parameters, moving from an attractive to a very attractive rating. Despite recent price declines and mixed returns relative to the broader market, the company’s valuation metrics now present a compelling case for investors seeking value in the small-cap segment.
Read full news article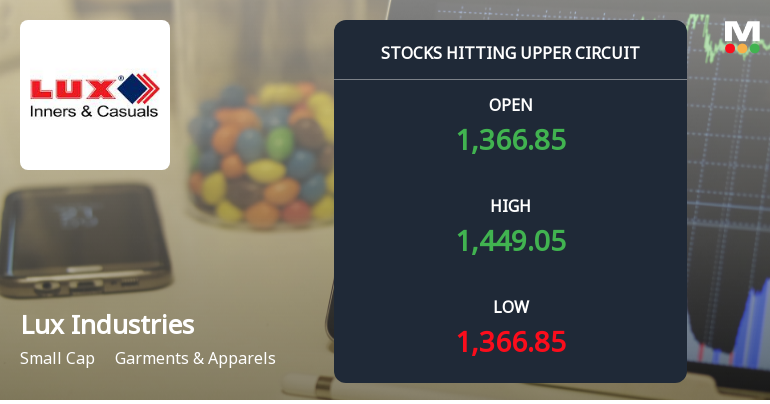
Lux Industries Ltd Locks at Upper Circuit With 5% Gain — Buyers Queue, Sellers Absent
At Rs 1,449.3, the buying was done — not because demand dried up, but because the exchange wouldn't let the stock go any higher. Lux Industries Ltd locked at its upper circuit of 5% on 1 Jun 2026, with buyers queuing and no sellers willing to part with shares.
Read full news article Announcements
Announcement under Regulation 30 (LODR)-Newspaper Publication
03-Jun-2026 | Source : BSEIntimation-Newspaper Publication
Compliances-Reg.24(A)-Annual Secretarial Compliance
27-May-2026 | Source : BSEAnnual Secretarial Compliance Report for the Financial Year 2025-2026.
Announcement under Regulation 30 (LODR)-Newspaper Publication
22-May-2026 | Source : BSENewspaper Publication of the Audited Financial Results of the company for the quarter and year ended March 31 2026
Corporate Actions

No Upcoming Board Meetings

Lux Industries Ltd has declared 100% dividend, ex-date: 15 Sep 25

Lux Industries Ltd has announced 2:10 stock split, ex-date: 06 Jun 16

No Bonus history available

No Rights history available
Quality key factors
Valuation key factors
Technicals key factors
 Technical Indicator Scale: Bearish, Mildly Bearish, Sideways, Mildly Bullish, Bullish Turned
 Shareholding Snapshot : Mar 2026
Shareholding Compare (%holding)
Promoters
None
Held by 0 Schemes
Held by 37 FIIs (0.74%)
Pradip Kumar Todi (14.68%)
Life Insurance Corporation Of India (4.74%)
15.76%
Quarterly Results Snapshot (Consolidated) - Mar'26 - YoY

YoY Growth in quarter ended Mar 2026 is 6.77% vs 15.57% in Mar 2025

YoY Growth in quarter ended Mar 2026 is -8.75% vs -13.41% in Mar 2025
Half Yearly Results Snapshot (Consolidated) - Sep'25
Growth in half year ended Sep 2025 is 14.05% vs 4.56% in Sep 2024
Growth in half year ended Sep 2025 is -44.79% vs 58.38% in Sep 2024
Nine Monthly Results Snapshot (Consolidated) - Dec'25
YoY Growth in nine months ended Dec 2025 is 16.45% vs 9.56% in Dec 2024
YoY Growth in nine months ended Dec 2025 is -48.87% vs 58.45% in Dec 2024
Annual Results Snapshot (Consolidated) - Mar'26
YoY Growth in year ended Mar 2026 is 13.38% vs 11.13% in Mar 2025
YoY Growth in year ended Mar 2026 is -37.21% vs 27.63% in Mar 2025
About Lux Industries Ltd

Company Coordinates


