
Compare M & B Engineer. with Similar Stocks
Stock DNA
Construction
INR 1,649 Cr (Small Cap)
17.00
26
0.00%
-0.29
12.12%
2.46
Total Returns (Price + Dividend) 
M & B Engineer. for the last several years.
Risk Adjusted Returns v/s
Returns Beta

News

M & B Engineering Ltd is Rated Sell by MarketsMOJO
M & B Engineering Ltd is rated 'Sell' by MarketsMOJO, with this rating last updated on 01 June 2026. However, the analysis and financial metrics discussed here reflect the company’s current position as of 04 June 2026, providing investors with the most up-to-date insight into the stock’s fundamentals, valuation, financial trends, and technical outlook.
Read full news article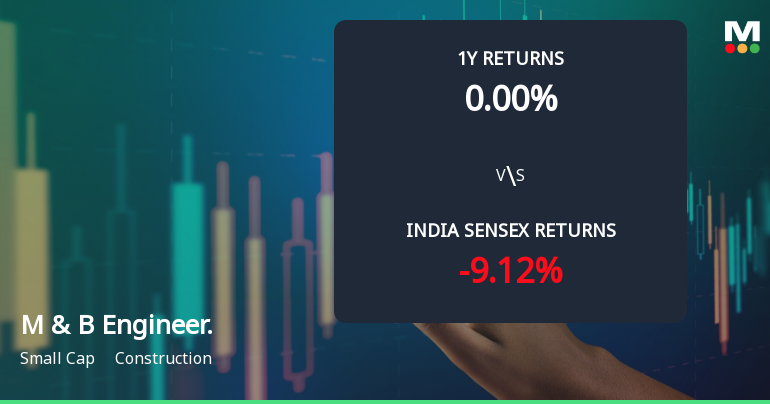
M & B Engineering Ltd Technical Momentum Shifts Amid Bearish Signals
M & B Engineering Ltd, a small-cap player in the construction sector, has experienced a notable shift in its technical momentum, moving from a mildly bullish to a mildly bearish trend. This change is underscored by mixed signals from key technical indicators such as MACD, RSI, Bollinger Bands, and moving averages, reflecting growing investor caution amid a challenging market backdrop.
Read full news article
M & B Engineering Ltd is Rated Hold by MarketsMOJO
M & B Engineering Ltd is rated 'Hold' by MarketsMOJO, with this rating last updated on 12 May 2026. However, the analysis and financial metrics discussed here reflect the company’s current position as of 24 May 2026, providing investors with the most recent insights into its performance and outlook.
Read full news article Announcements
Announcement under Regulation 30 (LODR)-Analyst / Investor Meet - Intimation
06-Jun-2026 | Source : BSEM & B Engineering Limited has informed the Exchange about Schedule of meet
Announcement under Regulation 30 (LODR)-Investor Presentation
01-Jun-2026 | Source : BSEM&B Engineering Limited has informed the Stock Exchange about a clarification to the Investor Presentation submitted on 12th May 2026 regarding Cash Flow Statement slide
Announcement under Regulation 30 (LODR)-Analyst / Investor Meet - Intimation
19-May-2026 | Source : BSEM & B Engineering Limited has informed the Exchange about Schedule of meet
Corporate Actions

No Upcoming Board Meetings

No Dividend history available

No Splits history available

No Bonus history available

No Rights history available
Quality key factors
Valuation key factors
Technicals key factors
 Technical Indicator Scale: Bearish, Mildly Bearish, Sideways, Mildly Bullish, Bullish Turned
 Shareholding Snapshot : Mar 2026
Shareholding Compare (%holding)
Promoters
None
Held by 4 Schemes (4.99%)
Held by 10 FIIs (2.86%)
Girishbhai Manibhai Patel (27.13%)
Abu Dhabi Investment Authority - Stable (2.26%)
12.44%
Quarterly Results Snapshot (Standalone) - Mar'26 - QoQ

QoQ Growth in quarter ended Mar 2026 is 11.48% vs 8.36% in Dec 2025

QoQ Growth in quarter ended Mar 2026 is -25.27% vs 40.07% in Dec 2025
Half Yearly Results Snapshot (Standalone) - Sep'25
Not Applicable: The company has declared_date for only one period
Not Applicable: The company has declared_date for only one period
Nine Monthly Results Snapshot (Standalone) - Dec'25
Not Applicable: The company has declared_date for only one period
Not Applicable: The company has declared_date for only one period
Annual Results Snapshot (Standalone) - Mar'26
Not Applicable: The company has declared_date for only one period
Not Applicable: The company has declared_date for only one period
About M & B Engineering Ltd

Company Coordinates


