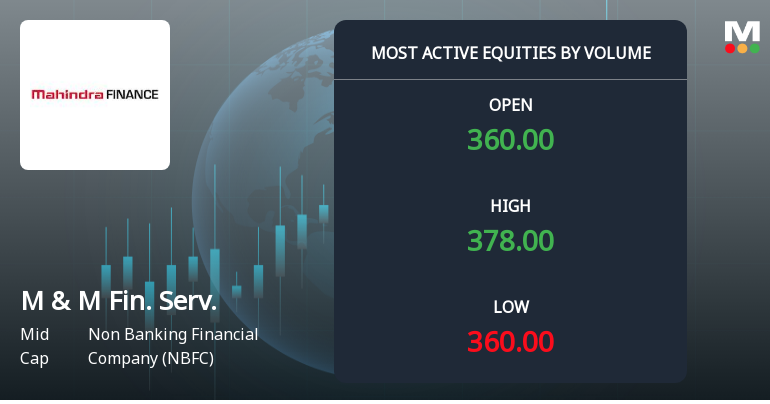
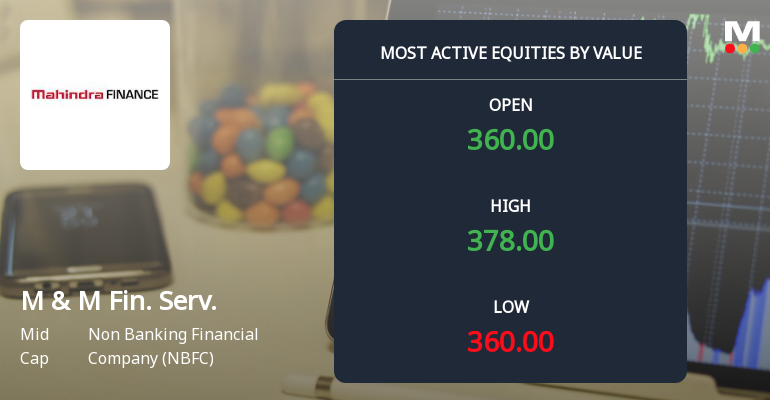
M & M Fin. Serv.

  • Market Cap: Mid Cap
  • Industry: Non Banking Financial Company (NBFC)
  • ISIN: INE774D01024
  • NSEID: M&MFIN
  • BSEID: 532720
INR
378.35
27.7 (7.9%)
BSENSE

Jul 22, 03:30 PM

BSE+NSE Vol: 5.96 cr

  • Price Points
  • Score
  • Mojo Parameters
  • Total Return
  • News and Corporate Actions
  • Key factors
  • Shareholding
  • Financials
  • CompanyCV
stock-summaryPrice Point
High/Low

1Day

52 Week

Valuation
Technical
Day's Volume

CASH

5.96 cr (243.35%) Volume

Shareholding (Jun 2026)

FII

9.53%

Held by 249 FIIs

DII

31.48%

Held by 89 DIIs

Promoter

52.49%

Why is Mahindra & Mahindra Financial Services Ltd falling/rising?

23-Jul-2026

As of 22-Jul, Mahindra & Mahindra Financial Services Ltd's stock price has risen to 378.35, reflecting a 7.9% increase due to strong recent performance, positive financial results, and heightened investor interest. The stock has outperformed the market with significant gains over the past week and month, alongside robust long-term growth metrics.

As of 22-Jul, Mahindra & Mahindra Financial Services Ltd is experiencing a rise in its stock price, currently at 378.35, reflecting a change of 27.7 or 7.9% increase. This upward movement can be attributed to several key factors. <BR><BR>Firstly, the stock has shown strong performance over the past week and month, with returns of 16.47% and 28.65% respectively, while the benchmark Sensex has declined by 0.56% and 0.44% during the same periods. This indicates that the stock is outperforming the broader market. Additionally, the stock has been on a consecutive gain streak for the last two days, accumulating a total return of 17.28% in this short period.<BR><BR>Moreover, the stock opened with a gain of 2.67% today and reached an intraday high of Rs 384.55, showcasing strong investor interest and momentum. The trading volume has also significantly increased, with delivery volume rising by 648% against the 5-day average, indicating heightened investor participation.<BR><BR>From a fundamental perspective, the company has demonstrated robust long-term growth, with operating profits increasing at a compound annual growth rate (CAGR) of 16.51%. The net profit has surged by 77.92%, and the company has reported positive results for the last two consecutive quarters. This strong financial performance is further supported by a return on equity (ROE) of 11.1 and a fair valuation compared to its peers.<BR><BR>In summary, the combination of strong recent performance, positive financial results, and increased investor participation has contributed to the rising stock price of Mahindra & Mahindra Financial Services Ltd.

View full answer

Are Mahindra & Mahindra Financial Services Ltd latest results good or bad?

22-Jul-2026

Mahindra & Mahindra Financial Services Ltd reported strong Q1 FY27 results, with a net profit of ₹926.03 crores, up 75.43% year-on-year, and record net sales of ₹5,717.91 crores. While the overall performance is positive, concerns include a high debt-equity ratio and a slight decline in operating margin, necessitating careful asset quality management.

Mahindra & Mahindra Financial Services Ltd (M&MFIN) has reported strong results for Q1 FY27, indicating a positive performance overall. The consolidated net profit surged to ₹926.03 crores, reflecting a remarkable 75.43% year-on-year increase, which is a significant improvement compared to the previous year. Additionally, net sales, primarily from interest earned, reached an all-time high of ₹5,717.91 crores, marking a 14.57% increase year-on-year.<BR><BR>The profit after tax (PAT) margin also saw a substantial rise, expanding to 16.22%, up 562 basis points from the same quarter last year, which suggests improved profitability. While there was a slight sequential decline in net profit compared to the previous quarter, this is largely attributed to seasonal factors.<BR><BR>However, there are some concerns to consider. The operating margin showed a minor decline from the previous quarter, and the company's debt-equity ratio remains high at 4.82 times, indicating significant financial leverage. This high leverage can amplify both returns and risks, making asset quality management crucial for sustained profitability.<BR><BR>Overall, the results are generally viewed as good, showcasing strong growth and operational resilience despite some underlying challenges. The stock has also performed well, with a recent surge indicating positive market sentiment. Investors should keep an eye on the company's ability to maintain asset quality and manage its leverage moving forward.

View full answer

Should I buy, sell or hold Mahindra & Mahindra Financial Services Ltd?

22-Jul-2026

How big is M & M Fin. Serv.?

11-Jun-2026

As of 10th June, Mahindra & Mahindra Financial Services Ltd has a market capitalization of 39,524.00 Cr and reported net sales of 21,005.37 Cr and net profit of 2,854.53 Cr over the latest four quarters.

As of 10th June, <BR><BR>Market Cap: Mahindra & Mahindra Financial Services Ltd has a market capitalization of 39,524.00 Cr, categorizing it as a Mid Cap company.<BR><BR>Recent Quarterly Performance: The sum of Net Sales for the latest 4 quarters is 21,005.37 Cr, while the sum of Net Profit for the same period is 2,854.53 Cr.<BR><BR>Balance Sheet Snapshot: The reporting period is March 2025, with Shareholder's Funds amounting to 21,529.46 Cr and Total Assets totaling 1,43,276.71 Cr.

View full answer

Who are in the management team of M & M Fin. Serv.?

11-Jun-2026

The management team of M & M Fin. Serv. includes Vice Chairman Ramesh Iyer, Chairman Anish Shah, Managing Director & CEO Raul Rebello, and several directors including Amit Sinha and Ashwani Ghai, along with independent directors and Company Secretary Brijbala Batwal.

The management team of M & M Fin. Serv. includes the following key individuals:<BR><BR>1. **Ramesh Iyer** - Vice Chairman & Managing Director<BR>2. **Anish Shah** - Chairman (Non-Executive)<BR>3. **Raul Rebello** - Managing Director & CEO<BR>4. **Raul Rebello** - Whole Time Director<BR>5. **Amit Sinha** - Director<BR>6. **Ashwani Ghai** - Director<BR>7. **Amarjyoti Barua** - Director<BR><BR>Additionally, the board features several independent directors:<BR>- **Rama Bijapurkar**<BR>- **C B Bhave**<BR>- **Milind Sarwate**<BR>- **Rebecca Nugent**<BR>- **Dhananjay Mungale**<BR>- **Diwakar Gupta**<BR><BR>Lastly, **Brijbala Batwal** serves as the Company Secretary and Compliance Officer.

View full answer

Who are the peers of the M & M Fin. Serv.?

11-Jun-2026

M & M Fin. Serv.'s peers include L&T Finance Ltd, SBI Cards, HDB FINANC SER, Sundaram Finance, Authum Invest., Poonawalla Fin, Tata Inv. Corpn., Manappuram Fin., and Chola Financial. In terms of management risk and growth, M & M Fin. Serv. has average ratings, with a 1-year return of -1.14%, better than SBI Cards but lower than L&T Finance Ltd's 36.08%.

Peers: The peers of M & M Fin. Serv. are L&T Finance Ltd, SBI Cards, HDB FINANC SER, Sundaram Finance, Authum Invest., Poonawalla Fin, Tata Inv.Corpn., Manappuram Fin., and Chola Financial.<BR><BR>Quality Snapshot: Excellent management risk is observed at SBI Cards, while Good management risk is found at HDB FINANC SER, Sundaram Finance, and Manappuram Fin. Average management risk is present at L&T Finance Ltd, Authum Invest., M & M Fin. Serv., Poonawalla Fin, and Chola Financial, and the rest. Below Average management risk is noted at Tata Inv.Corpn. Peers with Excellent growth include Poonawalla Fin and Chola Financial, while Average growth is found at SBI Cards, Sundaram Finance, M & M Fin. Serv., and Tata Inv.Corpn., and the rest. Below Average growth is seen at L&T Finance Ltd, HDB FINANC SER, Authum Invest., and Manappuram Fin., while the rest have Below Average growth.<BR><BR>Return Snapshot: The peer with the highest 1-year return is L&T Finance Ltd at 36.08%, while SBI Cards has the lowest at -41.95%. M & M Fin. Serv. has a 1-year return of -1.14%, which is higher than SBI Cards but lower than L&T Finance Ltd. Additionally, several peers, including SBI Cards, Sundaram Finance, Authum Invest., Poonawalla Fin, Tata Inv.Corpn., Chola Financial, and IIFL Finance, have negative six-month returns.

View full answer

What does M & M Fin. Serv. do?

10-Jun-2026

Mahindra & Mahindra Financial Services Ltd is a Mid Cap NBFC that provides financial services, with recent quarterly net sales of ₹5,539 Cr and a net profit of ₹938 Cr. The company has a market cap of ₹39,524 Cr and key metrics include a P/E ratio of 13.00 and a dividend yield of 2.28%.

Overview: <BR>Mahindra & Mahindra Financial Services Ltd operates in the Non Banking Financial Company (NBFC) sector and is categorized as a Mid Cap company.<BR><BR>History: <BR>The company was incorporated on 1st January 1991 as 'Maxi Motors Financial Services Limited' and changed its name to Mahindra & Mahindra Financial Services Limited on November 3, 1992. The latest quarterly results reported net sales and net profit for March 2026.<BR><BR>Financial Snapshot: <BR>Net Sales: 5,539 Cr (Quarterly Results - Mar 2026) <BR>Net Profit: 938 Cr (Quarterly Results - Mar 2026) <BR>Market Cap: INR 39,524 Cr (Mid Cap)<BR><BR>Key Metrics: <BR>P/E: 13.00 <BR>Industry P/E: 20 <BR>Dividend Yield: 2.28% <BR>Debt Equity: 4.82 <BR>Return on Equity: 11.09% <BR>Price to Book: 1.49 <BR><BR>Contact Details: <BR>Address: Gateway Building, Apollo Bunder Mumbai Maharashtra : 400001 <BR>Tel: 91-22-22895500 <BR>Email: investorhelpline_mmfsl@mahindra.com <BR>Website: http://www.mahindrafinance.com

View full answer

When is the next results date for Mahindra & Mahindra Financial Services Ltd?

17-Apr-2026

The next results date for Mahindra & Mahindra Financial Services Ltd is April 24, 2026.

The next results date for Mahindra & Mahindra Financial Services Ltd is scheduled for April 24, 2026.

View full answer

Is M & M Fin. Serv. technically bullish or bearish?

25-Nov-2025

As of November 24, 2025, the trend has shifted to bullish with moderate strength, supported by bullish MACD and Bollinger Bands, despite some short-term weakness indicated by a bearish weekly RSI and mildly bearish KST.

As of 24 November 2025, the technical trend has changed from mildly bullish to bullish. The current stance is bullish with moderate strength. Key indicators driving this stance include a bullish MACD on both weekly and monthly timeframes, bullish Bollinger Bands on both timeframes, and a bullish daily moving average. However, the weekly RSI is bearish, indicating some short-term weakness, while the KST shows a mildly bearish monthly signal. Overall, the bullish trend is supported by strong performance against the Sensex, particularly in the 1-week and 1-month returns.

View full answer

Is M & M Fin. Serv. overvalued or undervalued?

30-Oct-2025

As of October 29, 2025, M & M Fin. Serv. is fairly valued with a PE Ratio of 17.92, an EV to EBITDA of 8.29, and a Price to Book Value of 0.18, outperforming the Sensex with a year-to-date return of 23.21% compared to the Sensex's 8.78%.

As of 29 October 2025, the valuation grade for M & M Fin. Serv. moved from expensive to fair. The company is currently fairly valued based on its financial metrics. Key ratios include a PE Ratio of 17.92, an EV to EBITDA of 8.29, and a Price to Book Value of 0.18, which suggest a reasonable valuation relative to its earnings and asset base.<BR><BR>In comparison to its peers, M & M Fin. Serv. stands out against Bajaj Finance, which is very expensive with a PE Ratio of 37.96, and Life Insurance, which is very attractive with a PE Ratio of 11.8. The company's recent stock performance has outpaced the Sensex, with a year-to-date return of 23.21% compared to the Sensex's 8.78%, reinforcing the notion that it is fairly valued in the current market context.

View full answer

How has been the historical performance of M & M Fin. Serv.?

28-Oct-2025

M & M Fin. Serv. has shown consistent growth in net sales and profits from March 2019 to March 2025, with net sales increasing from INR 10,371.70 crore to INR 18,463.10 crore and profit after tax rising from INR 1,820.35 crore to INR 2,195.64 crore, despite rising interest expenses and negative cash flow in recent years. Total liabilities and assets both increased significantly during this period, indicating growing financial obligations.

Answer:<BR>The historical performance of M & M Fin. Serv. shows a consistent growth in net sales and profits over the years, with significant fluctuations in certain metrics.<BR><BR>Breakdown:<BR>M & M Fin. Serv. has demonstrated a steady increase in net sales from INR 10,371.70 crore in March 2019 to INR 18,463.10 crore in March 2025. The total operating income followed a similar trend, rising from INR 10,371.70 crore in March 2019 to INR 18,463.10 crore in March 2025. Operating profit (PBDIT) also increased significantly, reaching INR 11,698.32 crore in March 2025, up from INR 7,301.64 crore in March 2019. However, interest expenses have surged from INR 4,432.28 crore in March 2019 to INR 8,415.43 crore in March 2025, impacting profit before tax, which fluctuated over the years, peaking at INR 2,961.68 crore in March 2025. Profit after tax showed a similar upward trend, reaching INR 2,195.64 crore in March 2025, compared to INR 1,820.35 crore in March 2019. The company's total liabilities increased from INR 81,213.74 crore in March 2020 to INR 1,43,276.71 crore in March 2025, while total assets rose from INR 81,213.74 crore to INR 1,43,276.71 crore in the same period. Cash flow from operating activities has been negative in recent years, with a notable outflow of INR 15,601 crore in March 2025, despite a net cash inflow of INR 926 crore for that year. Overall, M & M Fin. Serv. has shown resilience and growth in revenue and profits, albeit with increasing financial obligations and cash flow challenges.

View full answer

Who are the top shareholders of the M & M Fin. Serv.?

06-Jun-2025

The top shareholders of M & M Fin. Serv. include Mahindra & Mahindra Limited with 52.16%, mutual funds with 17.48%, foreign institutional investors at 10.68%, and the Life Insurance Corporation of India holding 10.24%. Individual investors account for 5.12% of the shares.

The top shareholders of M & M Fin. Serv. include several key players. The majority shareholder is Mahindra & Mahindra Limited, which holds a significant 52.16% of the company. In addition, mutual funds collectively hold 17.48% through 28 different schemes, while foreign institutional investors (FIIs) account for 10.68% with 211 FIIs involved. The highest public shareholder is the Life Insurance Corporation of India, specifically the LIC-P & GS Fund, which holds 10.24%. Individual investors make up 5.12% of the shareholding.

View full answer

Has M & M Fin. Serv. declared dividend?

06-Jun-2025

Mahindra & Mahindra Financial Services Ltd has declared a dividend of 315% (₹6.3 per share) with an ex-date of July 16, 2024. While recent short-term returns have been negative, long-term returns over several years show strong positive growth.

Mahindra & Mahindra Financial Services Ltd has declared a dividend.<BR><BR>Dividend Details:<BR>- Percentage announced: 315%<BR>- Amount per share: 6.3<BR>- Ex-date: Jul-16-2024<BR><BR>Dividend Yield: 2.13%.<BR><BR>Total Returns by Period:<BR>Over the past 6 months, the price return was -0.68%, with a dividend return of 0%, resulting in a total return of -0.68%.<BR><BR>In the 1-year period, the price return was -0.72%, the dividend return was 2.16%, leading to a total return of 1.44%.<BR><BR>For the 2-year period, the price return was -6.12%, the dividend return was 3.89%, resulting in a total return of -2.23%.<BR><BR>During the 3-year period, the price return was 48.16%, with a dividend return of 9.39%, which resulted in a total return of 57.55%.<BR><BR>In the 4-year period, the price return was 64.2%, the dividend return was 10.53%, leading to a total return of 74.73%.<BR><BR>Over the 5-year period, the price return was 78.82%, with a dividend return of 9.03%, resulting in a total return of 87.85%.<BR><BR>Overall, Mahindra & Mahindra Financial Services Ltd has declared a significant dividend, and while recent short-term returns have been negative, the longer-term returns over several years show strong positive growth, indicating a potentially favorable investment outlook.

View full answer
iScoreScore
Click here to find our call on this stock
Strong Sell
Sell
Hold
Buy
Strong Buy

Dashboard

1

Strong Long Term Fundamental Strength with a 16.51% CAGR growth in Operating Profits

 
2

Healthy long term growth as Operating profit has grown by an annual rate of 16.51%

 
3

With a growth in Net Profit of 77.92%, the company declared Very Positive results in Jun 26

4

With ROE of 11.1, it has a Fair valuation with a 2 Price to Book Value

5

High Institutional Holdings at 41.02%

stock-summaryMojo Parameters

Mojo Parameters

Loading Valuation Snapshot...

Stock DNA

stock-summary
Industry

Non Banking Financial Company (NBFC)

stock-summary
Market cap

INR 51,387 Cr (Mid Cap)

stock-summary
P/E

16.00

stock-summary
Industry P/E

22

stock-summary
Dividend Yield

2.14%

stock-summary
Debt Equity

4.82

stock-summary
Return on Equity

11.09%

stock-summary
Price to Book

1.83

Revenue and Profits:
Net Sales:
5,718 Cr
(Quarterly Results - Jun 2026)
Net Profit:
926 Cr
stock-summaryTotal Returns
Total Returns (Price + Dividend) stock-summary
Dividend Yield (2.14%)
TimePeriod
Price Return
Dividend Return
Total Return
3 Months
26.03%
2.55%
28.58%
6 Months
4.94%
2.06%
7.0%
1 Year
42.24%
3.01%
45.25%
2 Years
33.03%
4.72%
37.75%
3 Years
24.35%
7.10%
31.45%
4 Years
84.29%
13.49%
97.78%
5 Years
151.85%
20.46%
172.31%

Latest dividend: 7.496619591346153 per share ex-dividend date: Jul-13-2026

Risk Adjusted Returns v/s stock-summary
Returns Beta
Icon
Beta has not been calculated since enough price history is not available
stock-summaryNews & Corporate Actions

Announcements stock-summary

Board Meeting Outcome for Outcome Of Board Meeting - Unaudited Standalone And Consolidated Financial Results Of The Company For The First Quarter Ended 30Th June 2026

21-Jul-2026 | Source : BSE

Outcome of Board Meeting - Unaudited Standalone and Consolidated Financial Results of the Company for the first quarter ended 30th June 2026

Outcome Of Board Meeting - Unaudited Standalone And Consolidated Financial Results Of The Company For The First Quarter Ended 30Th June 2026

21-Jul-2026 | Source : BSE

Financial Results for the quarter ended 30th June 2026

Shareholder Meeting / Postal Ballot-Outcome of AGM

21-Jul-2026 | Source : BSE

Proceedings of 36th Annual General Meeting

Corporate Actions stock-summary

stock-summary
BOARD MEETING

No Upcoming Board Meetings

stock-summary
DIVIDEND

Mahindra & Mahindra Financial Services Ltd has declared 375% dividend, ex-date: 13 Jul 26

stock-summary
SPLITS

Mahindra & Mahindra Financial Services Ltd has announced 2:10 stock split, ex-date: 15 Feb 13

stock-summary
BONUS

No Bonus history available

stock-summary
RIGHTS

Mahindra & Mahindra Financial Services Ltd has announced 1:8 rights issue, ex-date: 14 May 25

stock-summaryKey Factors

Quality key factors stock-summary

Factor
Value
Sales Growth (5y)
11.74%
EBIT Growth (5y)
16.51%
Net Debt to Equity (avg)
4.82
Institutional Holding
41.02%
ROE (avg)
9.86%

Valuation key factors

Factor
Value
P/E Ratio
16
Industry P/E
22
Price to Book Value
1.97
EV to EBIT
12.95
EV to EBITDA
12.58
EV to Capital Employed
1.18
EV to Sales
7.98
PEG Ratio
0.34
Dividend Yield
1.98%
ROCE (Latest)
8.64%
ROE (Latest)
11.09%

Technicals key factors

Indicator
Weekly
Monthly
MACD
Bullish
Mildly Bearish
RSI
No Signal
No Signal
Bollinger Bands
Bullish
Bullish
Moving Averages
Mildly Bearish (Daily)
KST
Mildly Bullish
Bullish
Dow Theory
No Trend
Mildly Bullish
OBV
Bullish
Bullish
stock-summary Technical Indicator Scale: Bearish, Mildly Bearish, Sideways, Mildly Bullish, Bullish  Turned 
stock-summaryShareholding
Shareholding Snapshot : Jun 2026stock-summary
Shareholding Compare (%holding) stock-summary
Majority shareholders

Promoters

Pledged Promoter Holdings

None

Mutual Funds

Held by 27 Schemes (16.68%)

FIIs

Held by 249 FIIs (9.53%)

Promoter with highest holding

Mahindra & Mahindra Limited (52.49%)

Highest Public shareholder

Life Insurance Corporation Of India, Lic-p&gs Fund, Lici Funds (10.26%)

Individual Investors Holdings

5.63%

stock-summaryFinancial
[
  {
    "link": "quarterly",
    "btn_text": "All Quarterly Results",
    "header": "Quarterly Results Snapshot (Consolidated) - Jun'26 - YoY",
    "rhs": [
      {
        "prefix": "Net Sales ",
        "suffix": "YoY Growth in quarter ended Jun 2026 is 14.57% vs 15.64% in Jun 2025",
        "dir": -1
      },
      {
        "prefix": "Consolidated Net Profit ",
        "suffix": "YoY Growth in quarter ended Jun 2026 is 75.43% vs 6.07% in Jun 2025",
        "dir": 1
      }
    ],
    "table": {
      "header": [
        "Jun'26",
        "Jun'25",
        "Change(%)"
      ],
      "body": [
        {
          "field": "Net Sales",
          "val1": "5,717.91",
          "val2": "4,990.61",
          "chgp": "14.57%",
          "chgp_class": "positive"
        },
        {
          "field": "Operating Profit (PBDIT) excl Other Income",
          "val1": "3,684.29",
          "val2": "3,026.45",
          "chgp": "21.74%",
          "chgp_class": "positive"
        },
        {
          "field": "Interest",
          "val1": "2,372.05",
          "val2": "2,279.98",
          "chgp": "4.04%",
          "chgp_class": "negative"
        },
        {
          "field": "Exceptional Items",
          "val1": "0.00",
          "val2": "0.00",
          "chgp": "",
          "chgp_class": "neutral"
        },
        {
          "field": "Consolidate Net Profit",
          "val1": "926.03",
          "val2": "527.87",
          "chgp": "75.43%",
          "chgp_class": "positive"
        },
        {
          "field": "Operating Profit Margin (Excl OI)",
          "val1": "64.43%",
          "val2": "60.64%",
          "chgp": "3.79%",
          "chgp_class": "positive"
        }
      ]
    }
  },
  {
    "link": "half-yearly",
    "btn_text": "All Half Yearly Results",
    "header": "Half Yearly Results Snapshot (Consolidated) - Sep'25",
    "rhs": [
      {
        "prefix": "Net Sales ",
        "suffix": " Growth in half year ended Sep 2025 is 14.08% vs 18.39% in Sep 2024",
        "dir": -1
      },
      {
        "prefix": "Consolidated Net Profit ",
        "suffix": " Growth in half year ended Sep 2025 is 23.14% vs 38.65% in Sep 2024",
        "dir": -1
      }
    ],
    "table": {
      "header": [
        "Sep'25",
        "Sep'24",
        "Change(%)"
      ],
      "body": [
        {
          "field": "Net Sales",
          "val1": "10,016.80",
          "val2": "8,780.67",
          "chgp": "14.08%",
          "chgp_class": "positive"
        },
        {
          "field": "Operating Profit (PBDIT) excl Other Income",
          "val1": "6,038.10",
          "val2": "5,274.71",
          "chgp": "14.47%",
          "chgp_class": "positive"
        },
        {
          "field": "Interest",
          "val1": "4,477.66",
          "val2": "4,022.75",
          "chgp": "11.31%",
          "chgp_class": "negative"
        },
        {
          "field": "Exceptional Items",
          "val1": "0.00",
          "val2": "0.00",
          "chgp": "",
          "chgp_class": "neutral"
        },
        {
          "field": "Consolidate Net Profit",
          "val1": "1,092.35",
          "val2": "887.08",
          "chgp": "23.14%",
          "chgp_class": "positive"
        },
        {
          "field": "Operating Profit Margin (Excl OI)",
          "val1": "60.28%",
          "val2": "60.07%",
          "chgp": "0.21%",
          "chgp_class": "positive"
        }
      ]
    }
  },
  {
    "link": "nine-monthly",
    "btn_text": "All Nine Monthly Results",
    "header": "Nine Monthly Results Snapshot (Consolidated) - Dec'25",
    "rhs": [
      {
        "prefix": "Net Sales ",
        "suffix": "YoY Growth in nine months ended Dec 2025 is 13.91% vs 17.90% in Dec 2024",
        "dir": -1
      },
      {
        "prefix": "Consolidated Net Profit ",
        "suffix": "YoY Growth in nine months ended Dec 2025 is 6.20% vs 42.96% in Dec 2024",
        "dir": -1
      }
    ],
    "table": {
      "header": [
        "Dec'25",
        "Dec'24",
        "Change(%)"
      ],
      "body": [
        {
          "field": "Net Sales",
          "val1": "15,466.64",
          "val2": "13,577.47",
          "chgp": "13.91%",
          "chgp_class": "positive"
        },
        {
          "field": "Operating Profit (PBDIT) excl Other Income",
          "val1": "9,575.30",
          "val2": "8,746.27",
          "chgp": "9.48%",
          "chgp_class": "positive"
        },
        {
          "field": "Interest",
          "val1": "6,713.68",
          "val2": "6,197.66",
          "chgp": "8.33%",
          "chgp_class": "negative"
        },
        {
          "field": "Exceptional Items",
          "val1": "-132.95",
          "val2": "0.00",
          "chgp": "",
          "chgp_class": "neutral"
        },
        {
          "field": "Consolidate Net Profit",
          "val1": "1,916.51",
          "val2": "1,804.65",
          "chgp": "6.20%",
          "chgp_class": "positive"
        },
        {
          "field": "Operating Profit Margin (Excl OI)",
          "val1": "61.91%",
          "val2": "64.42%",
          "chgp": "-2.51%",
          "chgp_class": "negative"
        }
      ]
    }
  },
  {
    "link": "annual",
    "btn_text": "All Annual Results",
    "header": "Annual Results Snapshot (Consolidated) - Mar'26",
    "rhs": [
      {
        "prefix": "Net Sales ",
        "suffix": "YoY Growth in year ended Mar 2026 is 13.77% vs 16.88% in Mar 2025",
        "dir": -1
      },
      {
        "prefix": "Consolidated Net Profit ",
        "suffix": "YoY Growth in year ended Mar 2026 is 26.20% vs 17.03% in Mar 2025",
        "dir": 1
      }
    ],
    "table": {
      "header": [
        "Mar'26",
        "Mar'25",
        "Change(%)"
      ],
      "body": [
        {
          "field": "Net Sales",
          "val1": "21,005.37",
          "val2": "18,463.10",
          "chgp": "13.77%",
          "chgp_class": "positive"
        },
        {
          "field": "Operating Profit (PBDIT) excl Other Income",
          "val1": "13,127.49",
          "val2": "11,630.96",
          "chgp": "12.87%",
          "chgp_class": "positive"
        },
        {
          "field": "Interest",
          "val1": "8,933.56",
          "val2": "8,415.43",
          "chgp": "6.16%",
          "chgp_class": "negative"
        },
        {
          "field": "Exceptional Items",
          "val1": "-132.95",
          "val2": "0.00",
          "chgp": "",
          "chgp_class": "neutral"
        },
        {
          "field": "Consolidate Net Profit",
          "val1": "2,854.53",
          "val2": "2,261.87",
          "chgp": "26.20%",
          "chgp_class": "positive"
        },
        {
          "field": "Operating Profit Margin (Excl OI)",
          "val1": "62.50%",
          "val2": "63.00%",
          "chgp": "-0.50%",
          "chgp_class": "negative"
        }
      ]
    }
  }
]

Quarterly Results Snapshot (Consolidated) - Jun'26 - YoYstock-summary

Jun'26
Jun'25
Change(%)
Net Sales
5,717.91
4,990.61
14.57%
Operating Profit (PBDIT) excl Other Income
3,684.29
3,026.45
21.74%
Interest
2,372.05
2,279.98
4.04%
Exceptional Items
0.00
0.00
Consolidate Net Profit
926.03
527.87
75.43%
Operating Profit Margin (Excl OI)
64.43%
60.64%
3.79%
Values in Rs Cr.
Direction Arrows
Net Sales

YoY Growth in quarter ended Jun 2026 is 14.57% vs 15.64% in Jun 2025

Direction Arrows
Consolidated Net Profit

YoY Growth in quarter ended Jun 2026 is 75.43% vs 6.07% in Jun 2025

Half Yearly Results Snapshot (Consolidated) - Sep'25stock-summary

Sep'25
Sep'24
Change(%)
Net Sales
10,016.80
8,780.67
14.08%
Operating Profit (PBDIT) excl Other Income
6,038.10
5,274.71
14.47%
Interest
4,477.66
4,022.75
11.31%
Exceptional Items
0.00
0.00
Consolidate Net Profit
1,092.35
887.08
23.14%
Operating Profit Margin (Excl OI)
60.28%
60.07%
0.21%
Values in Rs Cr.
Direction Arrows
Net Sales

Growth in half year ended Sep 2025 is 14.08% vs 18.39% in Sep 2024

Direction Arrows
Consolidated Net Profit

Growth in half year ended Sep 2025 is 23.14% vs 38.65% in Sep 2024

Nine Monthly Results Snapshot (Consolidated) - Dec'25stock-summary

Dec'25
Dec'24
Change(%)
Net Sales
15,466.64
13,577.47
13.91%
Operating Profit (PBDIT) excl Other Income
9,575.30
8,746.27
9.48%
Interest
6,713.68
6,197.66
8.33%
Exceptional Items
-132.95
0.00
Consolidate Net Profit
1,916.51
1,804.65
6.20%
Operating Profit Margin (Excl OI)
61.91%
64.42%
-2.51%
Values in Rs Cr.
Direction Arrows
Net Sales

YoY Growth in nine months ended Dec 2025 is 13.91% vs 17.90% in Dec 2024

Direction Arrows
Consolidated Net Profit

YoY Growth in nine months ended Dec 2025 is 6.20% vs 42.96% in Dec 2024

Annual Results Snapshot (Consolidated) - Mar'26stock-summary

Mar'26
Mar'25
Change(%)
Net Sales
21,005.37
18,463.10
13.77%
Operating Profit (PBDIT) excl Other Income
13,127.49
11,630.96
12.87%
Interest
8,933.56
8,415.43
6.16%
Exceptional Items
-132.95
0.00
Consolidate Net Profit
2,854.53
2,261.87
26.20%
Operating Profit Margin (Excl OI)
62.50%
63.00%
-0.50%
Values in Rs Cr.
Direction Arrows
Net Sales

YoY Growth in year ended Mar 2026 is 13.77% vs 16.88% in Mar 2025

Direction Arrows
Consolidated Net Profit

YoY Growth in year ended Mar 2026 is 26.20% vs 17.03% in Mar 2025

stock-summaryCompany CV
About Mahindra & Mahindra Financial Services Ltd stock-summary
stock-summary
Mahindra & Mahindra Financial Services Ltd
Mid Cap
Non Banking Financial Company (NBFC)
Mahindra & Mahindra Financial Services Limited (MMFSL) was incorporated on 1st January, 1991 as 'Maxi Motors Financial Services Limited'. M&M FSL had received Certificate of Commencement of Business on 19th February, 1991. Thereafter, the Company's name was changed from Maxi Motors Financial Services Limited to Mahindra & Mahindra Financial Services Limited dated November 3, 1992.
Company Coordinates stock-summary
Company Details
Gateway Building, Apollo Bunder Mumbai Maharashtra : 400001
stock-summary
Tel: 91-22-22895500
stock-summary
investorhelpline_mmfsl@mahindra.com
Registrar Details
Karvy Computershare Pvt Ltd., Karvy Selenium, Tower-B Plot No 31 & 32, Survey No 116/22, 115/24, 115/25, Financial District, Nanakramguda, Serilingampally, Mandal Ranga Reddy Dist, Hyderabad