
 Price Point
Compare M Tek Copper with Similar Stocks
ScoreDashboard
Weak Long Term Fundamental Strength with a -9.39% CAGR growth in Net Sales over the last 5 years
- Company's ability to service its debt is weak with a poor EBIT to Interest (avg) ratio of 0.03
- The company has been able to generate a Return on Equity (avg) of 5.76% signifying low profitability per unit of shareholders funds
With ROCE of 9.6, it has a Expensive valuation with a 2.2 Enterprise value to Capital Employed
Below par performance in long term as well as near term
Mojo ParametersStock DNA

Non - Ferrous Metals

INR 159 Cr (Micro Cap)

35.00
13

0.00%

0.82

8.98%

3.15
Total ReturnsTotal Returns (Price + Dividend) 
M Tek Copper for the last several years.
Risk Adjusted Returns v/s
Returns Beta
 News & Corporate Actions
News
Madhav Copper Ltd Valuation Shifts Signal Price Attractiveness Decline
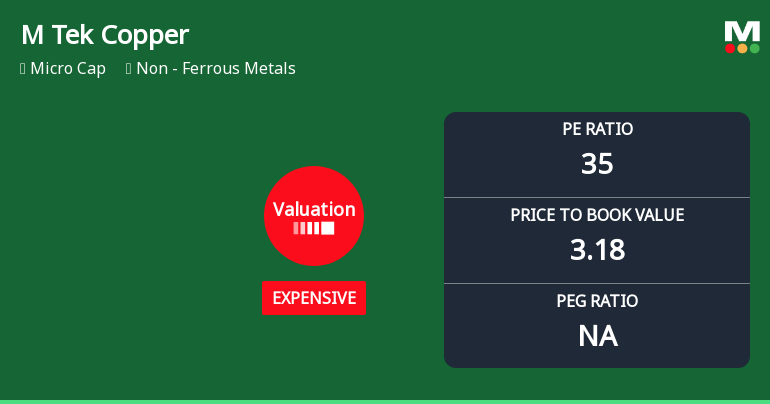
Madhav Copper Ltd, a micro-cap player in the Non-Ferrous Metals sector, has seen its valuation parameters shift notably, prompting a downgrade in its investment grade from Hold to Sell. With its price-to-earnings (P/E) ratio rising to 35.39 and price-to-book value (P/BV) at 3.18, the stock now trades at a premium compared to its historical averages and peer group, raising questions about its price attractiveness amid moderate returns and sector dynamics.
Read full news article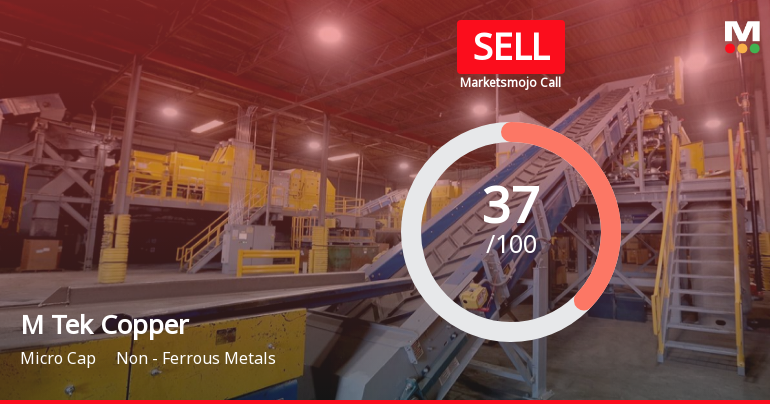
Madhav Copper Ltd is Rated Sell
Madhav Copper Ltd is rated Sell by MarketsMOJO, with this rating last updated on 03 June 2026. However, the analysis and financial metrics discussed here reflect the stock’s current position as of 09 August 2026, providing investors with the latest insights into the company’s performance and outlook.
Read full news article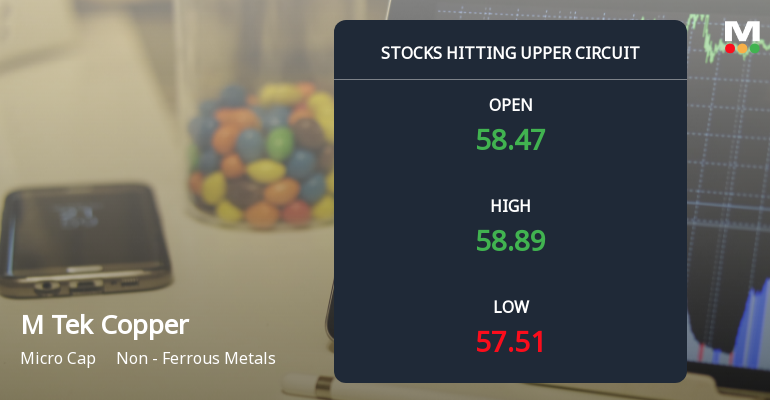
Madhav Copper Ltd Locks at Upper Circuit With 8.48% Gain — Buyers Queue, Sellers Absent
At Rs 59.3, the buying was done — not because demand dried up, but because the exchange wouldn't let the stock go any higher. Madhav Copper Ltd locked at its upper circuit of 8.48% on 6 Aug 2026, with buyers queuing and no sellers willing to part with shares.
Read full news article Announcements
Madhav Copper Limited - Clarification - Financial Results
03-Dec-2019 | Source : NSEMadhav Copper Limitedited for the quarter ended 30-Sep-2019 with respect to Regulation 33 of the SEBI (Listing Obligations and Disclosure Requirements) Regulations, 2015.
Madhav Copper Limited - Clarification
26-Nov-2019 | Source : NSEMadhav Copper Limited with respect to announcement dated 14-Nov-2019, regarding appointment of Company Secretary. On basis of above the Company is required to clarify following: 1. Date of appointment (as applicable) & term of appointment
Madhav Copper Limited - Outcome of Board Meeting
15-Nov-2019 | Source : NSEMadhav Copper Limited has informed the Exchange regarding Board meeting held on November 14, 2019 for approval of unaudited results for the half year ended on 30th September 2019 and appointment of Company Secretary
Corporate Actions

No Upcoming Board Meetings

No Dividend history available

M Tek Copper Ltd has announced 5:10 stock split, ex-date: 02 May 19

M Tek Copper Ltd has announced 1:1 bonus issue, ex-date: 22 Oct 19

No Rights history available
Key FactorsQuality key factors
Valuation key factors
Technicals key factors
 Technical Indicator Scale: Bearish, Mildly Bearish, Sideways, Mildly Bullish, Bullish Turned Shareholding
Shareholding Snapshot : Jun 2026
Shareholding Compare (%holding)
Promoters
None
Held by 0 Schemes
Held by 1 FIIs (0.0%)
Chauhan Rohitbhai Bhikhabhai (25.2%)
None
32.37%
FinancialQuarterly Results Snapshot (Standalone) - Mar'26 - YoY
 Compare with Peers
YoY Growth in quarter ended Mar 2026 is 102.07% vs 185.32% in Mar 2025

YoY Growth in quarter ended Mar 2026 is 69.19% vs -59.05% in Mar 2025

Half Yearly Results Snapshot (Standalone) - Sep'25
Growth in half year ended Sep 2025 is 93.87% vs 573.96% in Sep 2024
Growth in half year ended Sep 2025 is -59.22% vs 199.52% in Sep 2024
Nine Monthly Results Snapshot (Standalone) - Dec'25
YoY Growth in nine months ended Dec 2025 is 80.74% vs 297.08% in Dec 2024
YoY Growth in nine months ended Dec 2025 is -46.13% vs 200.00% in Dec 2024
Annual Results Snapshot (Standalone) - Mar'26
YoY Growth in year ended Mar 2026 is 87.86% vs 251.18% in Mar 2025
YoY Growth in year ended Mar 2026 is -4.26% vs 281.30% in Mar 2025
 Company CV
About M Tek Copper Ltd

Company Coordinates










