
Compare Maan Aluminium with Similar Stocks
Dashboard
Poor long term growth as Operating profit has grown by an annual rate -9.96% of over the last 5 years
Negative results in Mar 26
With ROE of 4.7, it has a Expensive valuation with a 2.6 Price to Book Value
Despite the size of the company, domestic mutual funds hold only 0% of the company
Stock DNA
Non - Ferrous Metals
INR 711 Cr (Micro Cap)
54.00
12
0.00%
0.03
4.74%
2.59
Total Returns (Price + Dividend) 
Latest dividend: 0.2474802015838733 per share ex-dividend date: Feb-16-2023
Risk Adjusted Returns v/s
Returns Beta

News
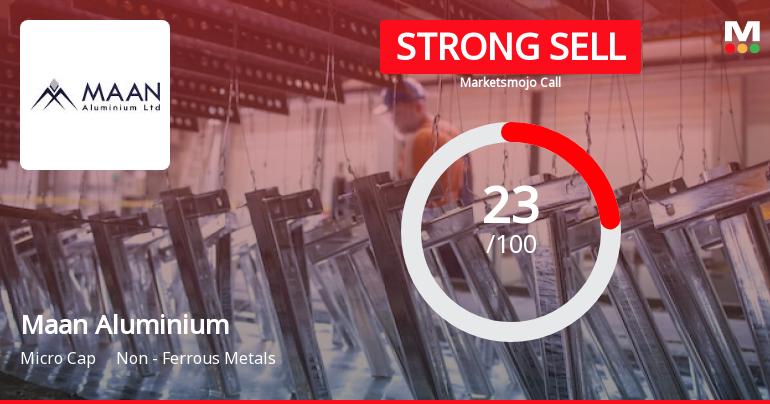
Maan Aluminium Ltd is Rated Strong Sell
Maan Aluminium Ltd is rated Strong Sell by MarketsMOJO, with this rating last updated on 24 June 2026. However, the analysis and financial metrics discussed here reflect the stock’s current position as of 17 July 2026, providing investors with an up-to-date perspective on the company’s performance and outlook.
Read full news article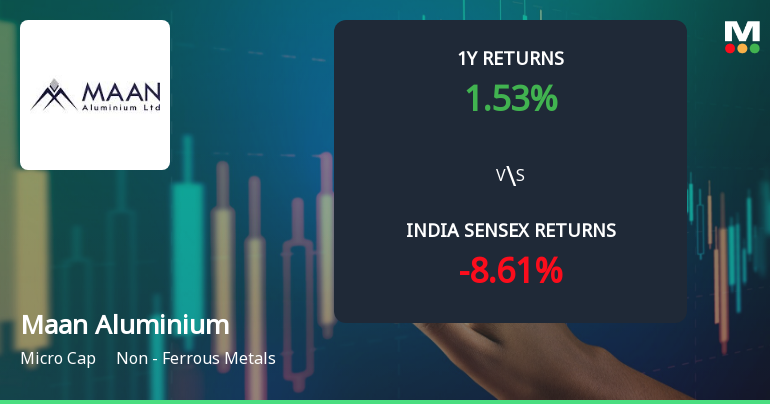
Maan Aluminium Ltd Faces Bearish Momentum Amid Technical Downgrade
Maan Aluminium Ltd, a micro-cap player in the Non-Ferrous Metals sector, has experienced a notable shift in its technical momentum, with key indicators signalling a bearish trend. The stock’s recent downgrade to a Strong Sell rating by MarketsMOJO reflects deteriorating price momentum and technical weakness, underscoring challenges ahead for investors amid broader market volatility.
Read full news article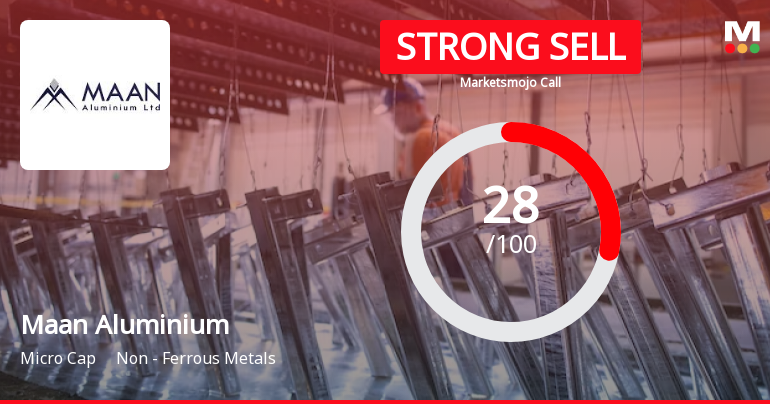
Maan Aluminium Ltd is Rated Strong Sell
Maan Aluminium Ltd is rated Strong Sell by MarketsMOJO, with this rating last updated on 24 June 2026. However, the analysis and financial metrics discussed here reflect the stock’s current position as of 06 July 2026, providing investors with the latest insights into the company’s fundamentals, valuation, financial trends, and technical outlook.
Read full news article Announcements
Maan Aluminium Limited - Resignation
18-Nov-2019 | Source : NSEMaan Aluminium Limited has informed the Exchange regarding Resignation of Mr Sandeep Kumar Agarwal as Chief Financial Officer of the company w.e.f. November 16, 2019.
Maan Aluminium Limited - Other General Purpose
15-Nov-2019 | Source : NSEMaan Aluminium Limited has submitted to the Exchange a copy of Disclosure of Related Party Transactions pursuant to Regulation 23(9) of SEBI (Listing Obligations and Disclosure Requirements) Regulations 2015 ( Listing Regulations ).
Maan Aluminium Limited - Shareholders meeting
05-Nov-2019 | Source : NSEMaan Aluminium Limited has informed the Exchange with copy of minutes of Annual General Meeting held on September 27, 2019
Corporate Actions

No Upcoming Board Meetings

Maan Aluminium Ltd has declared 10% dividend, ex-date: 16 Feb 23

Maan Aluminium Ltd has announced 5:10 stock split, ex-date: 27 Jul 23

Maan Aluminium Ltd has announced 1:1 bonus issue, ex-date: 27 Jul 23

No Rights history available
Quality key factors
Valuation key factors
Technicals key factors
 Technical Indicator Scale: Bearish, Mildly Bearish, Sideways, Mildly Bullish, Bullish Turned
 Shareholding Snapshot : Mar 2026
Shareholding Compare (%holding)
Promoters
None
Held by 1 Schemes (0.0%)
Held by 2 FIIs (0.01%)
Ravinder Nath Jain (37.08%)
Shanti Capinvest Private Limited (2.08%)
28.81%
Quarterly Results Snapshot (Standalone) - Mar'26 - QoQ

QoQ Growth in quarter ended Mar 2026 is 67.62% vs -20.52% in Dec 2025
QoQ Growth in quarter ended Mar 2026 is -39.93% vs -50.95% in Dec 2025
Half Yearly Results Snapshot (Standalone) - Sep'25
Growth in half year ended Sep 2025 is 5.25% vs -23.96% in Sep 2024
Growth in half year ended Sep 2025 is -0.23% vs -52.75% in Sep 2024
Nine Monthly Results Snapshot (Standalone) - Dec'25
YoY Growth in nine months ended Dec 2025 is -1.80% vs -21.15% in Dec 2024
YoY Growth in nine months ended Dec 2025 is -2.07% vs -54.57% in Dec 2024
Annual Results Snapshot (Standalone) - Mar'26
YoY Growth in year ended Mar 2026 is -0.18% vs -14.99% in Mar 2025
YoY Growth in year ended Mar 2026 is -15.99% vs -52.64% in Mar 2025
About Maan Aluminium Ltd

Company Coordinates


