
Compare Maan Aluminium with Similar Stocks
Dashboard
Poor long term growth as Operating profit has grown by an annual rate -9.96% of over the last 5 years
Negative results in Mar 26
With ROE of 4.7, it has a Expensive valuation with a 2.7 Price to Book Value
Despite the size of the company, domestic mutual funds hold only 0% of the company
Stock DNA
Non - Ferrous Metals
INR 736 Cr (Micro Cap)
57.00
12
0.00%
0.03
4.74%
2.64
Total Returns (Price + Dividend) 
Latest dividend: 1 per share ex-dividend date: Feb-16-2023
Risk Adjusted Returns v/s
Returns Beta

News
Maan Aluminium Ltd is Rated Sell
Maan Aluminium Ltd is rated 'Sell' by MarketsMOJO, with this rating last updated on 30 May 2026. However, the analysis and financial metrics discussed here reflect the stock's current position as of 12 June 2026, providing investors with an up-to-date view of the company’s fundamentals, valuation, financial trends, and technical outlook.
Read full news article
Maan Aluminium Ltd Downgraded to Sell Amid Mixed Financial and Technical Signals
Maan Aluminium Ltd, a micro-cap player in the non-ferrous metals sector, has seen its investment rating downgraded from Hold to Sell as of 30 May 2026. This shift reflects a combination of deteriorating financial performance, challenging valuation metrics, and a nuanced technical outlook, despite the company’s strong long-term returns relative to the broader market.
Read full news article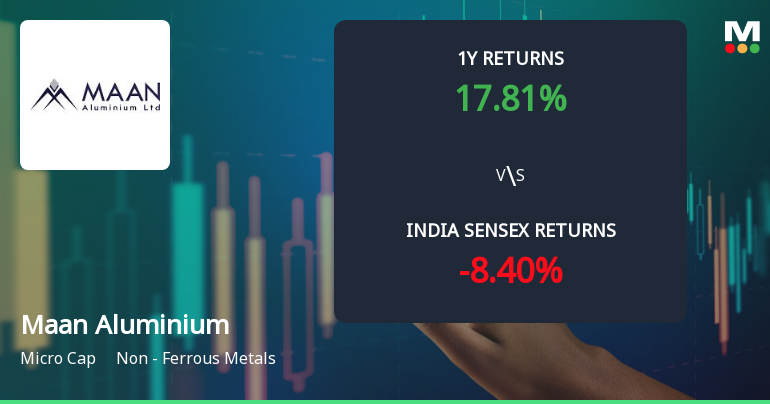
Maan Aluminium Ltd Technical Momentum Shifts Amid Market Volatility
Maan Aluminium Ltd, a micro-cap player in the Non - Ferrous Metals sector, has experienced a notable shift in its technical momentum, reflecting a complex interplay of bullish and bearish signals. Despite a recent downgrade from Hold to Sell by MarketsMOJO, the stock’s long-term returns remain impressive, though short-term price action suggests caution for investors.
Read full news article Announcements
Announcement under Regulation 30 (LODR)-Earnings Call Transcript
04-Jun-2026 | Source : BSEEarning Call Transcript
Announcement under Regulation 30 (LODR)-Analyst / Investor Meet - Outcome
02-Jun-2026 | Source : BSELink For Audio Recording of Investors Conference Call for Maan Aluminium Ltd. for the Quarter and year ended 31.03.2026
Announcement under Regulation 30 (LODR)-Investor Presentation
01-Jun-2026 | Source : BSEPresentation
Corporate Actions

No Upcoming Board Meetings

Maan Aluminium Ltd has declared 10% dividend, ex-date: 16 Feb 23

Maan Aluminium Ltd has announced 5:10 stock split, ex-date: 27 Jul 23

Maan Aluminium Ltd has announced 1:1 bonus issue, ex-date: 27 Jul 23

No Rights history available
Quality key factors
Valuation key factors
Technicals key factors
 Technical Indicator Scale: Bearish, Mildly Bearish, Sideways, Mildly Bullish, Bullish Turned
 Shareholding Snapshot : Mar 2026
Shareholding Compare (%holding)
Promoters
None
Held by 1 Schemes (0.0%)
Held by 2 FIIs (0.01%)
Ravinder Nath Jain (37.08%)
Shanti Capinvest Private Limited (2.08%)
28.81%
Quarterly Results Snapshot (Standalone) - Mar'26 - QoQ

QoQ Growth in quarter ended Mar 2026 is 67.62% vs -20.52% in Dec 2025
QoQ Growth in quarter ended Mar 2026 is -39.93% vs -50.95% in Dec 2025
Half Yearly Results Snapshot (Standalone) - Sep'25
Growth in half year ended Sep 2025 is 5.25% vs -23.96% in Sep 2024
Growth in half year ended Sep 2025 is -0.23% vs -52.75% in Sep 2024
Nine Monthly Results Snapshot (Standalone) - Dec'25
YoY Growth in nine months ended Dec 2025 is -1.80% vs -21.15% in Dec 2024
YoY Growth in nine months ended Dec 2025 is -2.07% vs -54.57% in Dec 2024
Annual Results Snapshot (Standalone) - Mar'26
YoY Growth in year ended Mar 2026 is -0.18% vs -14.99% in Mar 2025
YoY Growth in year ended Mar 2026 is -15.99% vs -52.64% in Mar 2025
About Maan Aluminium Ltd

Company Coordinates


