
Compare Machino Plastics with Similar Stocks
Stock DNA
Auto Components & Equipments
INR 156 Cr (Micro Cap)
115.00
35
0.00%
3.33
2.02%
2.32
Total Returns (Price + Dividend) 
Latest dividend: 1 per share ex-dividend date: Aug-05-2019
Risk Adjusted Returns v/s
Returns Beta

News
Are Machino Plastics Ltd latest results good or bad?
Machino Plastics Ltd's latest financial results for Q4 FY26 reveal a complex picture characterized by significant revenue growth juxtaposed with a sharp decline in profitability. The company reported a revenue of ₹143.08 crores, reflecting a year-on-year increase of 33.96%, which is indicative of strong demand and operational capacity, particularly in the auto components sector. This revenue growth is the highest recorded for the company in a quarter, suggesting effective sales strategies and robust client relationships, especially with major partners like Maruti Suzuki and Suzuki Motor Corporation. However, this positive top-line performance is overshadowed by a drastic decline in net profit, which fell to ₹0.25 crores, representing a 92.90% decrease year-on-year. This stark contrast highlights a troubling trend where revenue growth has not translated into sustainable profitability. The operating margin i...
Read full news article
Machino Plastics Ltd is Rated Strong Sell
Machino Plastics Ltd is rated Strong Sell by MarketsMOJO, with this rating last updated on 09 Feb 2026. However, the analysis and financial metrics discussed here reflect the company’s current position as of 31 May 2026, providing investors with an up-to-date view of its fundamentals, valuation, financial trends, and technical outlook.
Read full news article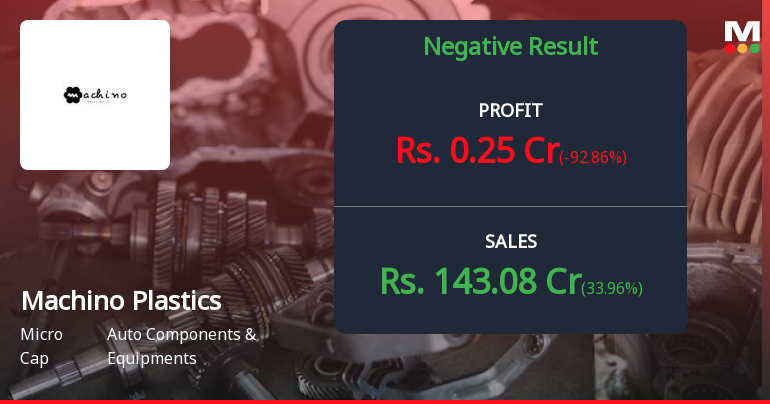
Machino Plastics Q4 FY26: Profit Collapse Amid Rising Debt Burden
Machino Plastics Ltd., India's pioneering plastic bumper and dashboard manufacturer, reported a dramatic 92.90% decline in net profit to ₹0.25 crores for Q4 FY26, down from ₹3.50 crores in the corresponding quarter last year. Despite revenue reaching a quarterly high of ₹143.08 crores, the company's profitability was severely impacted by a doubling of interest costs and deteriorating margins. The stock, currently trading at ₹261.00 with a market capitalisation of ₹157.00 crores, has declined 8.13% over the past year, significantly underperforming its sector which posted gains of 19.62%.
Read full news article Announcements
Announcement under Regulation 30 (LODR)-Newspaper Publication
01-Jun-2026 | Source : BSESubmission of Newspaper Publication under Regulation 47 of SEBI (Listing Obligations and Disclosure Requirements) Regulations 2015.
Compliances-Reg.24(A)-Annual Secretarial Compliance
30-May-2026 | Source : BSEAnnual Secretarial Compliance Report for the year ended on 31st March 2026
Board Meeting Outcome for Audited Financial Results For The Quarter And Year Ended On 31St March 2026
30-May-2026 | Source : BSEAudited Financial Results for the quarter and year ended on 31st March 2026 along with Auditors Report
Corporate Actions

No Upcoming Board Meetings

Machino Plastics Ltd has declared 10% dividend, ex-date: 05 Aug 19

No Splits history available

No Bonus history available

No Rights history available
Quality key factors
Valuation key factors
Technicals key factors
 Technical Indicator Scale: Bearish, Mildly Bearish, Sideways, Mildly Bullish, Bullish Turned
 Shareholding Snapshot : Dec 2025
Shareholding Compare (%holding)
Promoters
None
Held by 1 Schemes (0.01%)
Held by 0 FIIs
Machino Transport Private Limited (23.09%)
Vikas Malu (3.66%)
21.04%
Quarterly Results Snapshot (Standalone) - Mar'26 - YoY

YoY Growth in quarter ended Mar 2026 is 33.96% vs 31.20% in Mar 2025

YoY Growth in quarter ended Mar 2026 is -92.86% vs 184.55% in Mar 2025
Half Yearly Results Snapshot (Standalone) - Sep'25
Growth in half year ended Sep 2025 is 19.10% vs 8.96% in Sep 2024
Growth in half year ended Sep 2025 is -27.35% vs 160.00% in Sep 2024
Nine Monthly Results Snapshot (Standalone) - Dec'25
YoY Growth in nine months ended Dec 2025 is 24.17% vs 9.89% in Dec 2024
YoY Growth in nine months ended Dec 2025 is -78.61% vs 105.28% in Dec 2024
Annual Results Snapshot (Standalone) - Mar'26
YoY Growth in year ended Mar 2026 is 26.88% vs 15.05% in Mar 2025
YoY Growth in year ended Mar 2026 is -84.58% vs 131.98% in Mar 2025
About Machino Plastics Ltd

Company Coordinates


