
Compare Macpower CNC with Similar Stocks
Dashboard
The company is Net-Debt Free
Healthy long term growth as Operating profit has grown by an annual rate 47.86%
Positive results in Mar 26
With ROE of 19.3, it has a Fair valuation with a 5.7 Price to Book Value
Despite the size of the company, domestic mutual funds hold only 0% of the company
Below par performance in long term as well as near term
Stock DNA
Industrial Manufacturing
INR 977 Cr (Micro Cap)
29.00
36
0.16%
-0.03
19.33%
5.50
Total Returns (Price + Dividend) 
Latest dividend: 1.5 per share ex-dividend date: Sep-10-2025
Risk Adjusted Returns v/s
Returns Beta

News
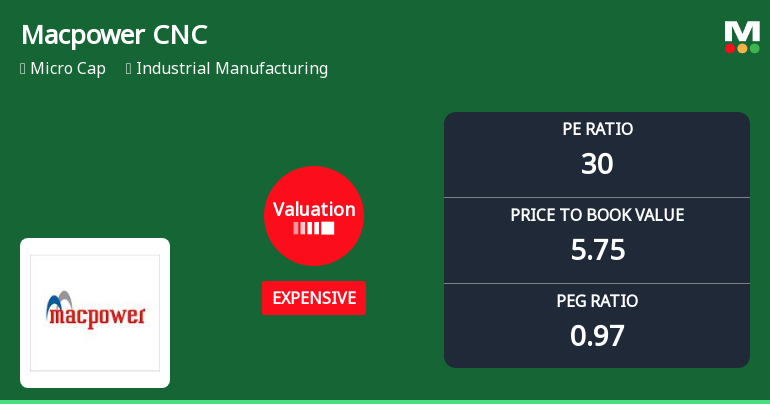
Macpower CNC Machines Ltd Valuation Shifts Signal Changing Market Sentiment
Macpower CNC Machines Ltd has witnessed a notable shift in its valuation parameters, moving from a fair to an expensive rating, prompting a reassessment of its price attractiveness amid evolving market dynamics and peer comparisons.
Read full news article
Macpower CNC Machines Ltd is Rated Hold
Macpower CNC Machines Ltd is rated 'Hold' by MarketsMOJO, with this rating last updated on 27 May 2026. However, the analysis and financial metrics discussed here reflect the stock's current position as of 08 June 2026, providing investors with an up-to-date view of the company’s fundamentals, returns, and market performance.
Read full news article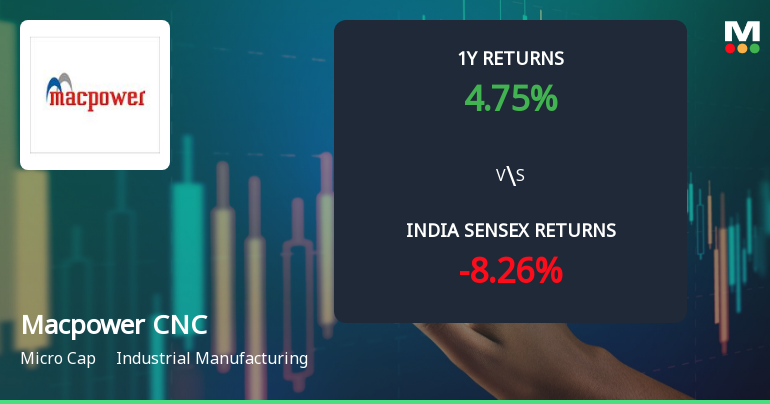
Macpower CNC Machines Ltd Technical Momentum Shifts Signal Mildly Bullish Outlook
Macpower CNC Machines Ltd, a micro-cap player in the industrial manufacturing sector, has recently exhibited a shift in price momentum from sideways to mildly bullish. Despite a mixed bag of technical indicator signals, the stock’s current price movement and trend assessments suggest cautious optimism for investors navigating this evolving landscape.
Read full news article Announcements
Macpower CNC Machines Limited - Investor Presentation
15-Nov-2019 | Source : NSEMacpower CNC Machines Limited has informed the Exchange regarding Investor Presentation for financial result of half year ended on September 30, 2019.
Macpower CNC Machines Limited - Statement of deviation(s) or variation(s) under Reg. 32
25-Oct-2019 | Source : NSEMacpower CNC Machines Limited has informed the Exchange regarding Statement of deviation(s) or variation(s) under Reg. 32 of SEBI (LODR) Regulations 2015
Corporate Actions

No Upcoming Board Meetings

Macpower CNC Machines Ltd has declared 15% dividend, ex-date: 10 Sep 25

No Splits history available

Macpower CNC Machines Ltd has announced 2:100 bonus issue, ex-date: 30 Jun 20

No Rights history available
Quality key factors
Valuation key factors
Technicals key factors
 Technical Indicator Scale: Bearish, Mildly Bearish, Sideways, Mildly Bullish, Bullish Turned
 Shareholding Snapshot : Mar 2026
Shareholding Compare (%holding)
Promoters
None
Held by 0 Schemes
Held by 0 FIIs
Rupeshkumar Jagdishchandra Mehta (31.52%)
Stellar Wealth Partners India Fund I Lp (1.01%)
19.99%
Quarterly Results Snapshot (Standalone) - Mar'26 - YoY

YoY Growth in quarter ended Mar 2026 is 25.35% vs 12.06% in Mar 2025
YoY Growth in quarter ended Mar 2026 is 18.02% vs -2.82% in Mar 2025
Half Yearly Results Snapshot (Standalone) - Sep'25
Growth in half year ended Sep 2025 is 20.95% vs 17.15% in Sep 2024

Growth in half year ended Sep 2025 is 13.07% vs 50.43% in Sep 2024
Nine Monthly Results Snapshot (Standalone) - Dec'25
YoY Growth in nine months ended Dec 2025 is 28.16% vs 7.08% in Dec 2024
YoY Growth in nine months ended Dec 2025 is 41.27% vs 10.32% in Dec 2024
Annual Results Snapshot (Standalone) - Mar'26
YoY Growth in year ended Mar 2026 is 27.26% vs 8.56% in Mar 2025
YoY Growth in year ended Mar 2026 is 33.14% vs 5.56% in Mar 2025
About Macpower CNC Machines Ltd

Company Coordinates


