
 Price Point
Compare Madhusudan Inds. with Similar Stocks
ScoreDashboard
Weak Long Term Fundamental Strength with a -189.05% CAGR growth in Operating Profits over the last 5 years
- Company's ability to service its debt is weak with a poor EBIT to Interest (avg) ratio of -0.98
- The company has been able to generate a Return on Capital Employed (avg) of 0.42% signifying low profitability per unit of total capital (equity and debt)
Risky - Negative EBITDA


 Total Returns
Total Returns (Price + Dividend) 
Madhusudan Inds. for the last several years.
Risk Adjusted Returns v/s
Returns Beta
 News & Corporate Actions
News
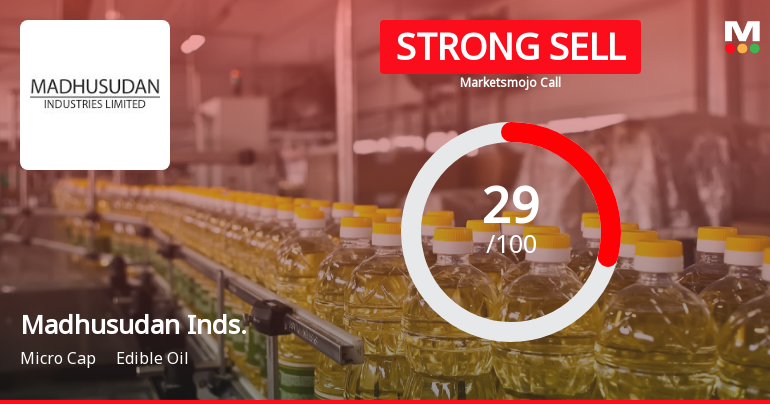
Madhusudan Industries Downgraded to Strong Sell Amid Weak Fundamentals and Technical Setbacks
Madhusudan Industries Ltd, a micro-cap player in the edible oil sector, has seen its investment rating downgraded from Sell to Strong Sell as of 30 Sep 2026. This revision reflects deteriorating technical indicators, weak long-term financial trends, and valuation concerns despite a recent positive quarterly performance. The stock’s current Mojo Score stands at 29.0, underscoring heightened risk for investors amid sideways technical momentum and persistent fundamental challenges.
Read full news article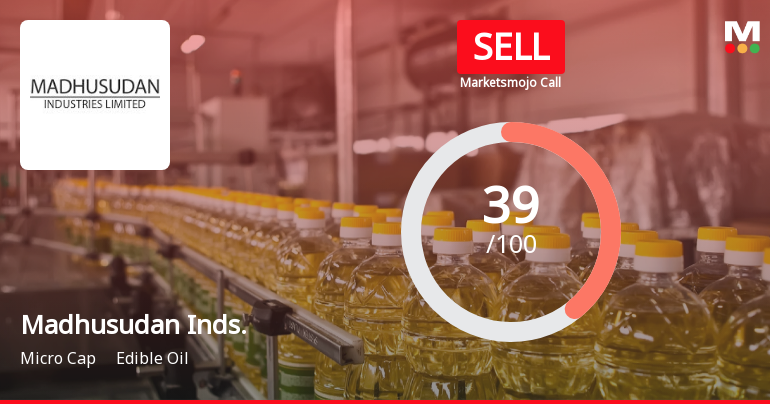
Madhusudan Industries Ltd Upgraded from Strong Sell to Sell on Technical Improvements
Madhusudan Industries Ltd, a micro-cap player in the edible oil sector, has seen its investment rating upgraded from Strong Sell to Sell as of 18 Sep 2026. This shift is primarily driven by a mild improvement in technical indicators, even as the company continues to face significant fundamental headwinds. The stock’s recent price movement and quarterly financial results provide a nuanced picture for investors weighing risk and opportunity.
Read full news article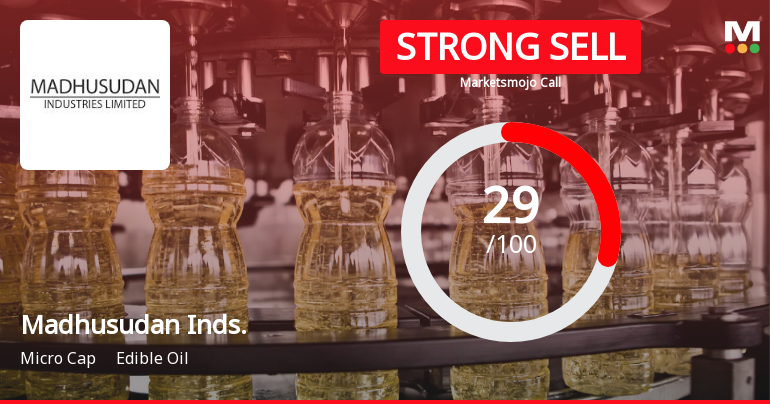
Madhusudan Industries Downgraded to Strong Sell Amid Technical and Fundamental Weakness
Madhusudan Industries Ltd, a micro-cap player in the edible oil sector, has seen its investment rating downgraded from Sell to Strong Sell as of 9 September 2026. This shift reflects deteriorating technical indicators, weak long-term fundamentals, and a challenging financial trend, despite a recent positive quarterly performance. The downgrade highlights growing investor caution amid sideways technical momentum and persistent profitability concerns.
Read full news article Announcements
Closure of Trading Window
28-Sep-2026 | Source : BSEClosure of Trading Window
Disclosure Under Regulation 30 Of The SEBI (LODR) Regulations 2015
17-Sep-2026 | Source : BSEDisclosure under Regulation 30 of the SEBI (LODR) Regulations 2015
Announcement under Regulation 30 (LODR)-Newspaper Publication
10-Sep-2026 | Source : BSENewspaper Publication regarding Special Window for Re-lodgement of Share Transfer Deed
Corporate Actions

No Upcoming Board Meetings

No Dividend history available

No Splits history available

No Bonus history available

No Rights history available
Key FactorsQuality key factors
Valuation key factors
Technicals key factors
 Technical Indicator Scale: Bearish, Mildly Bearish, Sideways, Mildly Bullish, Bullish Turned Shareholding
Shareholding Snapshot : Jun 2026
Shareholding Compare (%holding)
Promoters
None
Held by 2 Schemes (0.0%)
Held by 0 FIIs
Vikram Investments Company Private Limited (17.43%)
Sajan Kumar Pasari (2.39%)
41.27%
FinancialQuarterly Results Snapshot (Standalone) - Jun'26 - QoQ
 Compare with Peers
 QoQ Growth in quarter ended Jun 2026 is 0.00% vs 0.00% in Mar 2026

QoQ Growth in quarter ended Jun 2026 is 373.73% vs -43.90% in Mar 2026

Half Yearly Results Snapshot (Standalone) - Sep'25

Growth in half year ended Sep 2025 is 4.76% vs 5.00% in Sep 2024
Growth in half year ended Sep 2025 is -45.33% vs -25.90% in Sep 2024
Nine Monthly Results Snapshot (Standalone) - Dec'25
YoY Growth in nine months ended Dec 2025 is 5.26% vs 4.40% in Dec 2024
YoY Growth in nine months ended Dec 2025 is -65.30% vs -36.52% in Dec 2024
Annual Results Snapshot (Standalone) - Mar'26
YoY Growth in year ended Mar 2026 is 4.72% vs 4.10% in Mar 2025
YoY Growth in year ended Mar 2026 is -7.69% vs -116.81% in Mar 2025
 Company CV
About Madhusudan Industries Ltd










