
Compare Madhusudan Sec. with Similar Stocks
Stock DNA
Non Banking Financial Company (NBFC)
INR 38 Cr (Micro Cap)
13.00
20
0.00%
0.00
5.97%
0.45
Total Returns (Price + Dividend) 
Madhusudan Sec. for the last several years.
Risk Adjusted Returns v/s
Returns Beta

News
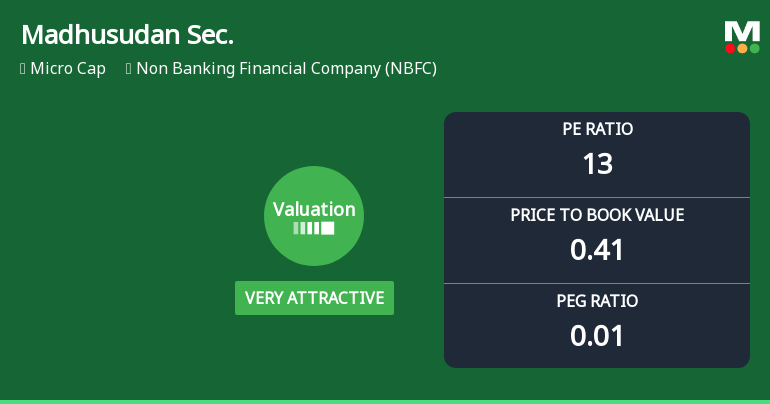
Madhusudan Securities Ltd Valuation Shifts to Very Attractive Amid Market Pressure
Madhusudan Securities Ltd, a micro-cap player in the Non Banking Financial Company (NBFC) sector, has seen a significant shift in its valuation parameters, moving from a risky to a very attractive valuation grade. Despite recent price pressures and underperformance relative to the Sensex, the stock’s current price-to-earnings (P/E) and price-to-book value (P/BV) ratios suggest compelling value for investors willing to look beyond short-term volatility.
Read full news article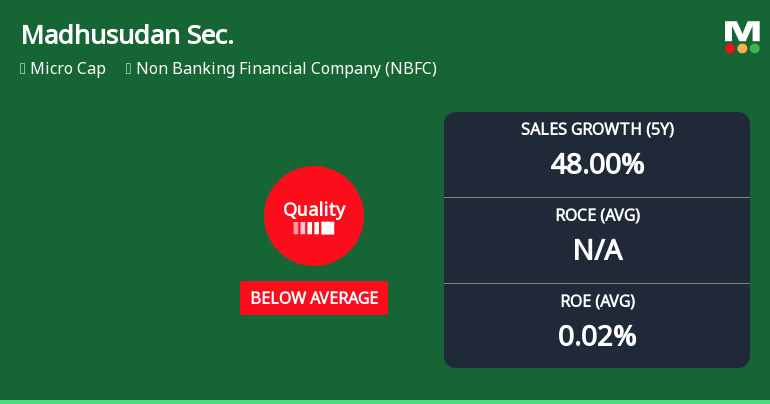
Madhusudan Securities Ltd Quality Grade Downgrade Highlights Fundamental Challenges
Madhusudan Securities Ltd, a micro-cap player in the Non Banking Financial Company (NBFC) sector, has recently seen its quality grade downgraded from "Does Not Qualify" to "Below Average," reflecting a deterioration in key business fundamentals. Despite impressive long-term sales and EBIT growth, the company faces challenges in return metrics and consistency, prompting a cautious stance from analysts and investors alike.
Read full news article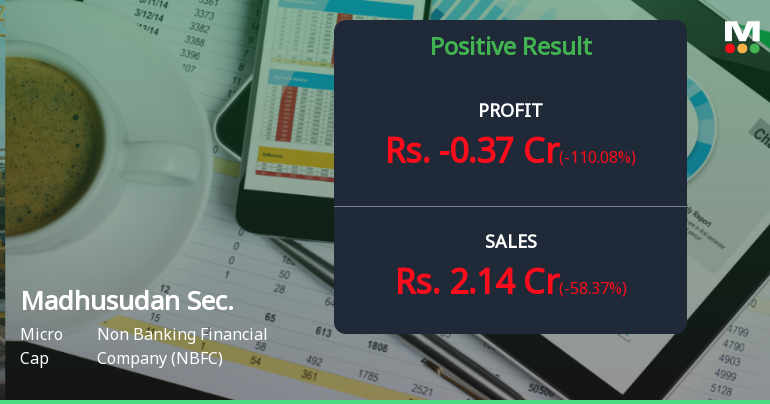
Madhusudan Securities Q4 FY26: Sharp Reversal as Losses Return Despite Revenue Spike
Madhusudan Securities Ltd., a micro-cap non-banking financial company, reported a jarring reversal in its March 2026 quarter performance, swinging to a consolidated net loss of ₹0.37 crores from a profit of ₹3.67 crores in the previous quarter. Despite a 5,250.00% year-on-year surge in net sales to ₹2.14 crores in Q4 FY26, the company's profitability collapsed due to an extraordinary depreciation charge of ₹1.58 crores—nearly 74% of quarterly revenue—raising serious questions about asset quality and operational sustainability.
Read full news article Announcements
Announcement under Regulation 30 (LODR)-Resignation of Chief Financial Officer (CFO)
01-Jun-2026 | Source : BSEWe wish to inform you that Mr. Vishwanatha Srinivas has resigned from the position of CFO and KMP of the company with effect from 31st May 2026
Compliances-Reg.24(A)-Annual Secretarial Compliance
30-May-2026 | Source : BSEAnnual Secretarial Compliance report for FY ended on 31.03.2026
Announcement under Regulation 30 (LODR)-Newspaper Publication
29-May-2026 | Source : BSEWe enclosed herewith the copy of newspaper publication pertaining to Audited Financial Results for the Quarter & Year ended on 31st March 2026 published in The Free Press Journal & Navshakti on 29t May 2026
Corporate Actions

No Upcoming Board Meetings

No Dividend history available

No Splits history available

No Bonus history available

No Rights history available
Quality key factors
Valuation key factors
Technicals key factors
 Technical Indicator Scale: Bearish, Mildly Bearish, Sideways, Mildly Bullish, Bullish Turned
 Shareholding Snapshot : Mar 2026
Shareholding Compare (%holding)
Non Institution
None
Held by 0 Schemes
Held by 2 FIIs (2.45%)
Salim Pyarli Govani (8.94%)
Cheralathan . (7.54%)
56.38%
Quarterly Results Snapshot (Consolidated) - Mar'26 - QoQ

QoQ Growth in quarter ended Mar 2026 is -58.37% vs 0.00% in Dec 2025
QoQ Growth in quarter ended Mar 2026 is -110.08% vs 1,568.00% in Dec 2025
Half Yearly Results Snapshot (Standalone) - Sep'25
Growth in half year ended Sep 2025 is 0.00% vs 0.00% in Sep 2024

Growth in half year ended Sep 2025 is 64.29% vs -281.82% in Sep 2024
Nine Monthly Results Snapshot (Standalone) - Dec'25
YoY Growth in nine months ended Dec 2025 is 0.00% vs 0.00% in Dec 2024
YoY Growth in nine months ended Dec 2025 is 1,013.33% vs -350.00% in Dec 2024
Annual Results Snapshot (Consolidated) - Mar'26
YoY Growth in year ended Mar 2026 is 10,314.29% vs -84.44% in Mar 2025
YoY Growth in year ended Mar 2026 is 438.55% vs -653.33% in Mar 2025
About Madhusudan Securities Ltd

Company Coordinates


