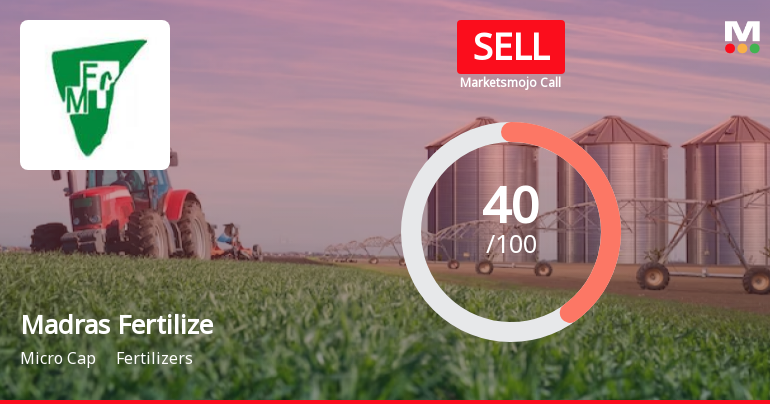
Madras Fertilize

  • Market Cap: Micro Cap
  • Industry: Fertilizers
  • ISIN: INE414A01015
  • NSEID: MADRASFERT
  • BSEID: 590134
INR
61.16
0.00 (0.00%)
BSENSE

Sep 17, 03:30 PM

BSE+NSE Vol: 43.13 k

  • Price Points
  • Score
  • Mojo Parameters
  • Total Return
  • News and Corporate Actions
  • Key factors
  • Shareholding
  • Financials
  • CompanyCV
stock-summaryPrice Point
High/Low

1Day

52 Week

Valuation
Technical
Day's Volume

CASH

43.13 k (-12.71%) Volume

Shareholding (Jun 2026)

FII

0.02%

Held by 3 FIIs

DII

0.05%

Held by 0 DIIs

Promoter

85.27%

Why is Madras Fertilizers Ltd falling/rising?

06-Sep-2026

As of 05-Sep, Madras Fertilizers Ltd's stock price is 65.10, down 0.5%, and has significantly underperformed the market with a year-to-date decline of 18.32%. The stock is trading below its moving averages, indicating a bearish trend and decreased investor confidence.

As of 05-Sep, Madras Fertilizers Ltd's stock price is currently at 65.10, reflecting a decrease of 0.33, or 0.5%. The stock has been underperforming compared to the broader market, as evidenced by its performance over various periods. Over the past week, the stock has declined by 3.80%, while the Sensex has only dropped by 0.97%. In the last month, the stock is down 2.75%, compared to a 2.44% decline in the Sensex. Year-to-date, Madras Fertilizers Ltd has seen a significant drop of 18.32%, while the Sensex has decreased by 10.21%. Over the past year, the stock has fallen by 30.71%, contrasting sharply with the Sensex's modest decline of 5.21%.<BR><BR>Despite a recent two-day gain of 1.96%, the stock is trading below its moving averages across multiple time frames, indicating a bearish trend. Additionally, there has been a notable decrease in investor participation, with delivery volume dropping by 59.75% compared to the five-day average. This decline in trading activity suggests a lack of confidence among investors, contributing to the stock's downward pressure. Overall, these factors indicate that Madras Fertilizers Ltd is currently experiencing a decline in its stock price.

View full answer

Who are in the management team of Madras Fertilize?

01-Sep-2026

The management team of Madras Fertilize includes U Saravanan (Chairman & Managing Director), Mohammad Bagher Dakhili, Harsh Malhotra (Director - Technical), Babak Bagherpour, Priya Ranjan Panda (Company Secretary), K Gurumurthy (Government Nominee), Nallabothu Venkat Rao, C R Jayanthi, Sanjay Vishnu Shetye (Non-Official Independent Director), and Samieh Kokabi. They oversee the company's operations and strategic direction.

The management team of Madras Fertilize includes the following individuals:<BR><BR>1. **U Saravanan** - Chairman & Managing Director<BR>2. **Mohammad Bagher Dakhili** - Nominee<BR>3. **Harsh Malhotra** - Director (Technical)<BR>4. **Babak Bagherpour** - Nominee<BR>5. **Priya Ranjan Panda** - Company Secretary & Compliance Officer<BR>6. **K Gurumurthy** - Nominee (Government)<BR>7. **Nallabothu Venkat Rao** - Independent Director<BR>8. **C R Jayanthi** - Independent Director<BR>9. **Sanjay Vishnu Shetye** - Non-Official Independent Director<BR>10. **Samieh Kokabi** - Nominee<BR><BR>This team is responsible for overseeing the operations and strategic direction of the company.

View full answer

What does Madras Fertilize do?

01-Sep-2026

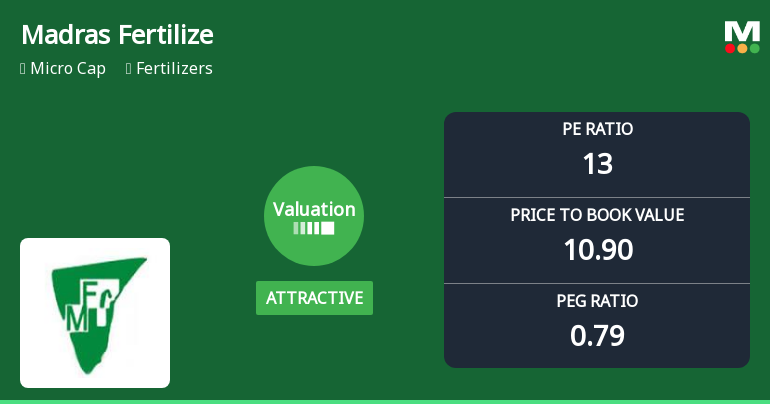
Madras Fertilizers Ltd is a micro-cap company in the fertilizers industry, established in 1966, with recent quarterly net sales of 814 Cr and net profit of 35 Cr. Key financial metrics include a P/E ratio of 13.00 and a market cap of INR 1,070 Cr.

Overview:<BR>Madras Fertilizers Ltd operates in the fertilizers industry and is categorized as a micro-cap company.<BR><BR>History:<BR>Madras Fertilizers Ltd was incorporated in December 1966 as a public sector undertaking. It commenced commercial production in November 1971. The latest quarterly results reported net sales and net profit for June 2026.<BR><BR>Financial Snapshot:<BR>- Net Sales: 814 Cr (Quarterly Results - Jun 2026)<BR>- Net Profit: 35 Cr (Quarterly Results - Jun 2026)<BR>- Market Cap: INR 1,070 Cr (Micro Cap)<BR><BR>Key Metrics:<BR>- P/E: 13.00<BR>- Industry P/E: 22<BR>- Dividend Yield: 0.00%<BR>- Debt Equity: -0.24<BR>- Return on Equity: 85.60%<BR>- Price to Book: 11.81<BR><BR>Contact Details:<BR>Address: Post Bag No 2, Manali Chennai Tamil Nadu : 600068<BR>Tel: 91-044-25942281/25945203<BR>Email: cs@madrasfert.co.in<BR>Website: http://www.madrasfert.nic.in

View full answer

Who are the peers of the Madras Fertilize?

01-Sep-2026

Madras Fertilize's peers include GSFC, National Fertilizer, SPIC, Zuari Agro Chem, Aries Agro, Khaitan Chemical, Indogulf Cropsci, Rama Phosphates, and Krishana Phosch. In terms of performance, Madras Fertilize has a 1-year return of -24.91%, with average management risk and below-average growth compared to its peers.

Peers: The peers of Madras Fertilize are GSFC, Natl.Fertilizer, SPIC, Zuari Agro Chem., Aries Agro, Khaitan Chemical, Indogulf Cropsci, Rama Phosphates, and Krishana Phosch.<BR><BR>Quality Snapshot: Excellent management risk is observed at GSFC, while Average management risk is found at Natl.Fertilizer, SPIC, Madras Fertilize, Aries Agro, Khaitan Chemical, Indogulf Cropsci, Rama Phosphates, and Krishana Phosch. Growth is rated as Good for Natl.Fertilizer and SPIC, while Below Average growth is noted for Madras Fertilize, Zuari Agro Chem., Aries Agro, Khaitan Chemical, Indogulf Cropsci, and Rama Phosphates, and the rest. Capital Structure is rated as Excellent for GSFC, Good for SPIC and Aries Agro, and Average for Madras Fertilize and Krishana Phosch, while Below Average is observed at Natl.Fertilizer, Zuari Agro Chem., Khaitan Chemical, Indogulf Cropsci.<BR><BR>Return Snapshot: The peer with the highest 1-year return is Aries Agro at 17.40%, while the lowest is Kothari Indl at -73.62%. Madras Fertilize's 1-year return is -24.91%, which is higher than Kothari Indl but lower than Aries Agro. Additionally, peers with a negative six-month return include GSFC, Natl.Fertilizer, Khaitan Chemical, and Rama Phosphates.

View full answer

How big is Madras Fertilize?

01-Sep-2026

As of 31st August, Madras Fertilizers Ltd has a market capitalization of 1,070.00 Cr, with recent net sales of 2,442.28 Cr and a net profit of 70.95 Cr.

As of 31st August, Madras Fertilizers Ltd has a market capitalization of 1,070.00 Cr, categorizing it as a Micro Cap company.<BR><BR>In the latest four quarters, Madras Fertilizers reported Net Sales of 2,442.28 Cr and a Net Profit of 70.95 Cr.<BR><BR>The latest annual period for the balance sheet is March 2025, where Shareholder's Funds stood at a loss of 32.30 Cr and Total Assets were valued at 2,233.35 Cr.

View full answer

Should I buy, sell or hold Madras Fertilizers Ltd?

13-Aug-2026

Are Madras Fertilizers Ltd latest results good or bad?

13-May-2026

Madras Fertilizers Ltd's latest Q4 FY26 results show a strong recovery with a net profit of ₹20.89 crores and a 67% revenue increase, but concerns remain due to a negative book value per share and reliance on government subsidies, indicating potential long-term challenges.

Madras Fertilizers Ltd's latest results for Q4 FY26 indicate a significant improvement compared to previous quarters, showcasing a strong recovery. The company reported a net profit of ₹20.89 crores, which is a remarkable increase from ₹2.52 crores in Q3 FY26 and a turnaround from a loss of ₹52.44 crores in Q4 FY25. This represents a sequential growth of approximately 729%.<BR><BR>Additionally, the revenue for Q4 FY26 reached ₹699.21 crores, marking a 67% increase from the previous quarter. The operating margin also improved to 5.12%, up from negative territory in the prior quarter, indicating better operational efficiency.<BR><BR>However, while these results reflect a positive trend and a recovery from previous losses, there are underlying concerns. The company's financial health is still challenged by a negative book value per share of ₹-1.99 and a shareholder funds deficit of ₹32.30 crores. The reliance on government subsidies and the volatility in margins raise questions about the sustainability of this recovery.<BR><BR>In summary, while the latest results are a positive step forward for Madras Fertilizers, the company still faces significant structural issues that could impact its long-term performance. Investors should weigh the recent improvements against these ongoing challenges.

View full answer

Is Madras Fertilize overvalued or undervalued?

19-Nov-2025

As of November 18, 2025, Madras Fertilize is considered very attractive and undervalued with a PE ratio of 16.27 and an EV to EBITDA of 10.12, significantly lower than its peers, despite recent stock performance lagging behind the Sensex.

As of 18 November 2025, the valuation grade for Madras Fertilize has moved from does not qualify to very attractive. This indicates a significant improvement in its perceived value. The company is currently assessed as undervalued, with a PE ratio of 16.27, an EV to EBITDA of 10.12, and a remarkably high ROE of 320.52%. <BR><BR>In comparison to its peers, Madras Fertilize's PE ratio is significantly lower than Coromandel International's 31 and F A C T's 646.81, both of which are categorized as very expensive. Additionally, its EV to EBITDA ratio is more favorable than that of Coromandel International and F A C T, which stand at 20.53 and 320.91, respectively. Despite recent stock performance lagging behind the Sensex, particularly in the year-to-date and one-year returns, the long-term performance over three, five, and ten years shows substantial growth, reinforcing the attractiveness of its current valuation.

View full answer

How has been the historical performance of Madras Fertilize?

18-Nov-2025

Madras Fertilize's historical performance shows a decline in net sales and profitability from Mar'23 to Mar'25, with net sales dropping from 3,447.09 Cr to 2,541.85 Cr and profit after tax decreasing from 185.33 Cr to 64.25 Cr, despite an increase in cash reserves. The company faces challenges in maintaining sales and profitability amid rising total liabilities.

Answer:<BR>The historical performance of Madras Fertilize shows a fluctuating trend in net sales and profitability over the years, with significant variations in operating income, expenses, and net profit.<BR><BR>Breakdown:<BR>Madras Fertilize's net sales peaked at 3,447.09 Cr in Mar'23 but have since declined to 2,541.85 Cr in Mar'25. The total operating income followed a similar pattern, decreasing from 3,447.09 Cr in Mar'23 to 2,541.85 Cr in Mar'25. Raw material costs also saw a decline from 2,486.30 Cr in Mar'23 to 1,387.64 Cr in Mar'25, while total expenditure, excluding depreciation, decreased from 3,124.96 Cr in Mar'23 to 2,419.44 Cr in Mar'25. Operating profit (PBDIT) dropped from 336.44 Cr in Mar'23 to 166.37 Cr in Mar'25, reflecting a decrease in operating profit margin from 9.34% to 4.82%. Profit before tax followed a similar downward trend, falling from 248.66 Cr in Mar'23 to 91.60 Cr in Mar'25, with profit after tax also declining from 185.33 Cr to 64.25 Cr in the same period. The company's total liabilities increased from 1,856.76 Cr in Mar'23 to 2,233.35 Cr in Mar'25, while total assets rose from 1,856.76 Cr to 2,233.35 Cr. Cash flow from operating activities decreased significantly from 687.00 Cr in Mar'23 to 116.00 Cr in Mar'25, and the closing cash and cash equivalents improved from 369.00 Cr in Mar'23 to 652.00 Cr in Mar'25. Overall, the financial performance of Madras Fertilize reflects challenges in maintaining sales and profitability, despite improvements in cash reserves.

View full answer

Is Madras Fertilize technically bullish or bearish?

06-Nov-2025

As of November 4, 2025, the market trend has shifted to a moderate bearish stance, driven by bearish MACD, Bollinger Bands, and moving averages, despite a mildly bullish indication from Dow Theory on the weekly chart.

As of 4 November 2025, the technical trend has changed from sideways to bearish. The current stance is bearish with a moderate strength. Key indicators driving this include a bearish MACD on both weekly and monthly time frames, bearish Bollinger Bands across both time frames, and bearish moving averages on the daily chart. The KST is also bearish on both weekly and monthly levels. Although Dow Theory indicates a mildly bullish stance on the weekly, the overall bearish signals dominate the analysis.

View full answer

Who are the top shareholders of the Madras Fertilize?

17-Jul-2025

The top shareholder of Madras Fertilize is the President of India, holding 59.5% of the shares. Individual investors own 13.46%, while Foreign Institutional Investors and mutual funds hold negligible stakes.

The top shareholders of Madras Fertilize include the President of India, who holds a significant 59.5% of the shares. The company has no pledged promoter holdings, and individual investors collectively hold 13.46% of the shares. Additionally, there are 6 Foreign Institutional Investors (FIIs) with a very small stake of 0.03%, and mutual funds are represented by just one scheme, holding 0.0%. There are no notable public shareholders listed.

View full answer

When is the next results date for Madras Fertilize?

06-Jun-2025

No Upcoming Board Meetings

Has Madras Fertilize declared dividend?

06-Jun-2025

No Dividend History Available

iScoreScore
Click here to find our call on this stock
Strong Sell
Sell
Hold
Buy
Strong Buy

Dashboard

1

Poor long term growth as Operating profit has grown by an annual rate -11.10% of over the last 5 years

 
2

Despite the size of the company, domestic mutual funds hold only 0.01% of the company

stock-summaryMojo Parameters

Mojo Parameters

Loading Valuation Snapshot...

Stock DNA

stock-summary
Industry

Fertilizers

stock-summary
Market cap

INR 984 Cr (Micro Cap)

stock-summary
P/E

13.00

stock-summary
Industry P/E

24

stock-summary
Dividend Yield

0.00%

stock-summary
Debt Equity

-0.24

stock-summary
Return on Equity

85.60%

stock-summary
Price to Book

10.70

Revenue and Profits:
Net Sales:
814 Cr
(Quarterly Results - Jun 2026)
Net Profit:
35 Cr
stock-summaryTotal Returns
Total Returns (Price + Dividend) stock-summary
Dividend Yield (0%)
TimePeriod
Price Return
Dividend Return
Total Return
3 Months
-13.49%
0%
-13.49%
6 Months
-4.65%
0%
-4.65%
1 Year
-32.75%
0%
-32.75%
2 Years
-43.61%
0%
-43.61%
3 Years
-24.26%
0%
-24.26%
4 Years
14.64%
0%
14.64%
5 Years
107.32%
0%
107.32%

Madras Fertilize for the last several years.

Risk Adjusted Returns v/s stock-summary
Returns Beta
Icon
Beta has not been calculated since enough price history is not available
stock-summaryNews & Corporate Actions

News

Madras Fertilizers Ltd Falls 4.41%: Valuation Shift Amid Bearish Momentum

Announcements stock-summary

Madras Fertilizers Limited - Shareholders meeting

18-Oct-2019 | Source : NSE

Madras Fertilizers Limited has informed the Exchange with copy of minutes of Annual General Meeting held on September 19, 2018

Shareholders meeting

20-Sep-2019 | Source : NSE

Madras Fertilizers Limited has submitted the Exchange a copy Srutinizers report of Annual General Meeting held on September 19, 2018. Further, the company has informed the Exchange regarding voting results.

Shareholders meeting

27-Aug-2019 | Source : NSE

Madras Fertilizers Limited has informed the Exchange regarding Notice of Annual General Meeting to be held on September 19, 2019

Corporate Actions stock-summary

stock-summary
BOARD MEETING

No Upcoming Board Meetings

stock-summary
DIVIDEND

No Dividend history available

stock-summary
SPLITS

No Splits history available

stock-summary
BONUS

No Bonus history available

stock-summary
RIGHTS

No Rights history available

stock-summaryKey Factors

Quality key factors stock-summary

Factor
Value
Sales Growth (5y)
6.13%
EBIT Growth (5y)
-11.10%
EBIT to Interest (avg)
2.24
Debt to EBITDA (avg)
8.07
Net Debt to Equity (avg)
-0.24
Sales to Capital Employed (avg)
2.60
Tax Ratio
20.74%
Dividend Payout Ratio
0
Pledged Shares
0
Institutional Holding
0.06%
ROCE (avg)
-84.04%
ROE (avg)
95.89%

Valuation key factors

Factor
Value
P/E Ratio
13
Industry P/E
24
Price to Book Value
10.70
EV to EBIT
11.50
EV to EBITDA
9.84
EV to Capital Employed
13.70
EV to Sales
0.39
PEG Ratio
0.78
Dividend Yield
NA
ROCE (Latest)
137.06%
ROE (Latest)
85.60%

Technicals key factors

Indicator
Weekly
Monthly
MACD
Bearish
Bearish
RSI
No Signal
No Signal
Bollinger Bands
Bearish
Bearish
Moving Averages
Bearish (Daily)
KST
Bearish
Bearish
Dow Theory
Mildly Bearish
Mildly Bearish
OBV
Mildly Bearish
No Trend
stock-summary Technical Indicator Scale: Bearish, Mildly Bearish, Sideways, Mildly Bullish, Bullish  Turned 
stock-summaryShareholding
Shareholding Snapshot : Jun 2026stock-summary
Shareholding Compare (%holding) stock-summary
Majority shareholders

Promoters

Pledged Promoter Holdings

None

Mutual Funds

Held by 1 Schemes (0.0%)

FIIs

Held by 3 FIIs (0.02%)

Promoter with highest holding

The President Of India (59.5%)

Highest Public shareholder

None

Individual Investors Holdings

13.45%

stock-summaryFinancial
[
  {
    "link": "quarterly",
    "btn_text": "All Quarterly Results",
    "header": "Quarterly Results Snapshot (Standalone) - Jun'26 - QoQ",
    "rhs": [
      {
        "prefix": "Net Sales ",
        "suffix": "QoQ Growth in quarter ended Jun 2026 is 16.42% vs 67.00% in Mar 2026",
        "dir": -1
      },
      {
        "prefix": "Standalone Net Profit ",
        "suffix": "QoQ Growth in quarter ended Jun 2026 is 65.58% vs 728.97% in Mar 2026",
        "dir": -1
      }
    ],
    "table": {
      "header": [
        "Jun'26",
        "Mar'26",
        "Change(%)"
      ],
      "body": [
        {
          "field": "Net Sales",
          "val1": "814.01",
          "val2": "699.21",
          "chgp": "16.42%",
          "chgp_class": "positive"
        },
        {
          "field": "Operating Profit (PBDIT) excl Other Income",
          "val1": "52.60",
          "val2": "35.82",
          "chgp": "46.85%",
          "chgp_class": "positive"
        },
        {
          "field": "Interest",
          "val1": "15.35",
          "val2": "14.76",
          "chgp": "4.00%",
          "chgp_class": "negative"
        },
        {
          "field": "Exceptional Items",
          "val1": "0.00",
          "val2": "-8.38",
          "chgp": "100.00%",
          "chgp_class": "positive"
        },
        {
          "field": "Standalone Net Profit",
          "val1": "34.59",
          "val2": "20.89",
          "chgp": "65.58%",
          "chgp_class": "positive"
        },
        {
          "field": "Operating Profit Margin (Excl OI)",
          "val1": "6.46%",
          "val2": "5.12%",
          "chgp": "1.34%",
          "chgp_class": "positive"
        }
      ]
    }
  },
  {
    "link": "half-yearly",
    "btn_text": "All Half Yearly Results",
    "header": "Half Yearly Results Snapshot (Standalone) - Sep'25",
    "rhs": [
      {
        "prefix": "Net Sales ",
        "suffix": " Growth in half year ended Sep 2025 is -0.43% vs 29.95% in Sep 2024",
        "dir": -1
      },
      {
        "prefix": "Standalone Net Profit ",
        "suffix": " Growth in half year ended Sep 2025 is 35.54% vs 235.46% in Sep 2024",
        "dir": -1
      }
    ],
    "table": {
      "header": [
        "Sep'25",
        "Sep'24",
        "Change(%)"
      ],
      "body": [
        {
          "field": "Net Sales",
          "val1": "1,182.45",
          "val2": "1,187.57",
          "chgp": "-0.43%",
          "chgp_class": "negative"
        },
        {
          "field": "Operating Profit (PBDIT) excl Other Income",
          "val1": "76.93",
          "val2": "76.50",
          "chgp": "0.56%",
          "chgp_class": "positive"
        },
        {
          "field": "Interest",
          "val1": "29.77",
          "val2": "32.03",
          "chgp": "-7.06%",
          "chgp_class": "positive"
        },
        {
          "field": "Exceptional Items",
          "val1": "0.00",
          "val2": "0.00",
          "chgp": "",
          "chgp_class": "neutral"
        },
        {
          "field": "Standalone Net Profit",
          "val1": "57.01",
          "val2": "42.06",
          "chgp": "35.54%",
          "chgp_class": "positive"
        },
        {
          "field": "Operating Profit Margin (Excl OI)",
          "val1": "6.51%",
          "val2": "6.44%",
          "chgp": "0.07%",
          "chgp_class": "positive"
        }
      ]
    }
  },
  {
    "link": "nine-monthly",
    "btn_text": "All Nine Monthly Results",
    "header": "Nine Monthly Results Snapshot (Standalone) - Dec'25",
    "rhs": [
      {
        "prefix": "Net Sales ",
        "suffix": "YoY Growth in nine months ended Dec 2025 is -19.41% vs 35.16% in Dec 2024",
        "dir": -1
      },
      {
        "prefix": "Standalone Net Profit ",
        "suffix": "YoY Growth in nine months ended Dec 2025 is -48.98% vs 241.03% in Dec 2024",
        "dir": -1
      }
    ],
    "table": {
      "header": [
        "Dec'25",
        "Dec'24",
        "Change(%)"
      ],
      "body": [
        {
          "field": "Net Sales",
          "val1": "1,601.14",
          "val2": "1,986.78",
          "chgp": "-19.41%",
          "chgp_class": "negative"
        },
        {
          "field": "Operating Profit (PBDIT) excl Other Income",
          "val1": "74.06",
          "val2": "183.21",
          "chgp": "-59.58%",
          "chgp_class": "negative"
        },
        {
          "field": "Interest",
          "val1": "44.09",
          "val2": "46.89",
          "chgp": "-5.97%",
          "chgp_class": "positive"
        },
        {
          "field": "Exceptional Items",
          "val1": "0.00",
          "val2": "0.00",
          "chgp": "",
          "chgp_class": "neutral"
        },
        {
          "field": "Standalone Net Profit",
          "val1": "59.53",
          "val2": "116.69",
          "chgp": "-48.98%",
          "chgp_class": "negative"
        },
        {
          "field": "Operating Profit Margin (Excl OI)",
          "val1": "4.63%",
          "val2": "9.22%",
          "chgp": "-4.59%",
          "chgp_class": "negative"
        }
      ]
    }
  },
  {
    "link": "annual",
    "btn_text": "All Annual Results",
    "header": "Annual Results Snapshot (Standalone) - Mar'26",
    "rhs": [
      {
        "prefix": "Net Sales ",
        "suffix": "YoY Growth in year ended Mar 2026 is -9.47% vs 14.03% in Mar 2025",
        "dir": -1
      },
      {
        "prefix": "Standalone Net Profit ",
        "suffix": "YoY Growth in year ended Mar 2026 is 25.17% vs 1,055.58% in Mar 2025",
        "dir": -1
      }
    ],
    "table": {
      "header": [
        "Mar'26",
        "Mar'25",
        "Change(%)"
      ],
      "body": [
        {
          "field": "Net Sales",
          "val1": "2,300.35",
          "val2": "2,541.08",
          "chgp": "-9.47%",
          "chgp_class": "negative"
        },
        {
          "field": "Operating Profit (PBDIT) excl Other Income",
          "val1": "109.88",
          "val2": "121.64",
          "chgp": "-9.67%",
          "chgp_class": "negative"
        },
        {
          "field": "Interest",
          "val1": "58.85",
          "val2": "62.37",
          "chgp": "-5.64%",
          "chgp_class": "positive"
        },
        {
          "field": "Exceptional Items",
          "val1": "-8.38",
          "val2": "0.00",
          "chgp": "",
          "chgp_class": "neutral"
        },
        {
          "field": "Standalone Net Profit",
          "val1": "80.42",
          "val2": "64.25",
          "chgp": "25.17%",
          "chgp_class": "positive"
        },
        {
          "field": "Operating Profit Margin (Excl OI)",
          "val1": "4.78%",
          "val2": "4.79%",
          "chgp": "-0.01%",
          "chgp_class": "negative"
        }
      ]
    }
  }
]

Quarterly Results Snapshot (Standalone) - Jun'26 - QoQstock-summary

Jun'26
Mar'26
Change(%)
Net Sales
814.01
699.21
16.42%
Operating Profit (PBDIT) excl Other Income
52.60
35.82
46.85%
Interest
15.35
14.76
4.00%
Exceptional Items
0.00
-8.38
100.00%
Standalone Net Profit
34.59
20.89
65.58%
Operating Profit Margin (Excl OI)
6.46%
5.12%
1.34%
Values in Rs Cr.
Direction Arrows
Net Sales

QoQ Growth in quarter ended Jun 2026 is 16.42% vs 67.00% in Mar 2026

Direction Arrows
Standalone Net Profit

QoQ Growth in quarter ended Jun 2026 is 65.58% vs 728.97% in Mar 2026

Half Yearly Results Snapshot (Standalone) - Sep'25stock-summary

Sep'25
Sep'24
Change(%)
Net Sales
1,182.45
1,187.57
-0.43%
Operating Profit (PBDIT) excl Other Income
76.93
76.50
0.56%
Interest
29.77
32.03
-7.06%
Exceptional Items
0.00
0.00
Standalone Net Profit
57.01
42.06
35.54%
Operating Profit Margin (Excl OI)
6.51%
6.44%
0.07%
Values in Rs Cr.
Direction Arrows
Net Sales

Growth in half year ended Sep 2025 is -0.43% vs 29.95% in Sep 2024

Direction Arrows
Standalone Net Profit

Growth in half year ended Sep 2025 is 35.54% vs 235.46% in Sep 2024

Nine Monthly Results Snapshot (Standalone) - Dec'25stock-summary

Dec'25
Dec'24
Change(%)
Net Sales
1,601.14
1,986.78
-19.41%
Operating Profit (PBDIT) excl Other Income
74.06
183.21
-59.58%
Interest
44.09
46.89
-5.97%
Exceptional Items
0.00
0.00
Standalone Net Profit
59.53
116.69
-48.98%
Operating Profit Margin (Excl OI)
4.63%
9.22%
-4.59%
Values in Rs Cr.
Direction Arrows
Net Sales

YoY Growth in nine months ended Dec 2025 is -19.41% vs 35.16% in Dec 2024

Direction Arrows
Standalone Net Profit

YoY Growth in nine months ended Dec 2025 is -48.98% vs 241.03% in Dec 2024

Annual Results Snapshot (Standalone) - Mar'26stock-summary

Mar'26
Mar'25
Change(%)
Net Sales
2,300.35
2,541.08
-9.47%
Operating Profit (PBDIT) excl Other Income
109.88
121.64
-9.67%
Interest
58.85
62.37
-5.64%
Exceptional Items
-8.38
0.00
Standalone Net Profit
80.42
64.25
25.17%
Operating Profit Margin (Excl OI)
4.78%
4.79%
-0.01%
Values in Rs Cr.
Direction Arrows
Net Sales

YoY Growth in year ended Mar 2026 is -9.47% vs 14.03% in Mar 2025

Direction Arrows
Standalone Net Profit

YoY Growth in year ended Mar 2026 is 25.17% vs 1,055.58% in Mar 2025

stock-summaryCompany CV
About Madras Fertilizers Ltd stock-summary
stock-summary
Madras Fertilizers Ltd
Micro Cap
Fertilizers
Madras Fertilizers Ltd (MFL) was incorporated in December 1966 as Public Sector undertaking, promoted by Government of India (GOI) and AMOCO India Inc. (Amoco - a Wholly owned subsidiary of Standard Oil Company of USA) holding 51% & 49% of Shares Respectively. MFL commenced commercial production in November 1971. In 1972 National Iranian Oil Company (NIOC) was inducted as shareholder acquiring 50% of AMOCO shareholding in MFL. In 1985 AMOCO has disinvested their MFL shares to GOI, NIOC & Public.
Company Coordinates stock-summary
Company Details
Post Bag No 2, Manali Chennai Tamil Nadu : 600068
stock-summary
Tel: 91-044-25942281/25945203
stock-summary
cs@madrasfert.co.in
Registrar Details
Integrated Enterprises (India) Ltd , II Floor , Kences Towers, No 1 Ramakrishna Street, North Usman Road, T Nagar, Chennai