
Compare Zuari Agro Chem. with Similar Stocks
Dashboard
With a Operating Losses, the company has a Weak Long Term Fundamental Strength
- Low ability to service debt as the company has a high Debt to EBITDA ratio of 2.07 times
- The company has been able to generate a Return on Capital Employed (avg) of 8.85% signifying low profitability per unit of total capital (equity and debt)
With a fall in Net Profit of -110.38%, the company declared Very Negative results in Mar 26
Total Returns (Price + Dividend) 
Latest dividend: 1 per share ex-dividend date: Jul-13-2017
Risk Adjusted Returns v/s
Returns Beta

News

Zuari Agro Chemicals Ltd is Rated Strong Sell
Zuari Agro Chemicals Ltd is rated Strong Sell by MarketsMOJO. This rating was last updated on 13 Feb 2026, reflecting a significant reassessment of the stock’s outlook. However, all fundamentals, returns, and financial metrics discussed below are current as of 01 July 2026, providing investors with the latest comprehensive view of the company’s position.
Read full news article
Zuari Agro Chemicals Ltd Faces Mixed Technical Signals Amid Bearish Momentum
Zuari Agro Chemicals Ltd, a micro-cap player in the fertiliser sector, is currently navigating a complex technical landscape marked by a shift from sideways to mildly bearish momentum. Despite some mildly bullish weekly indicators, monthly signals and daily moving averages suggest caution for investors as the stock trades near ₹226.80, down 1.97% on 30 June 2026.
Read full news article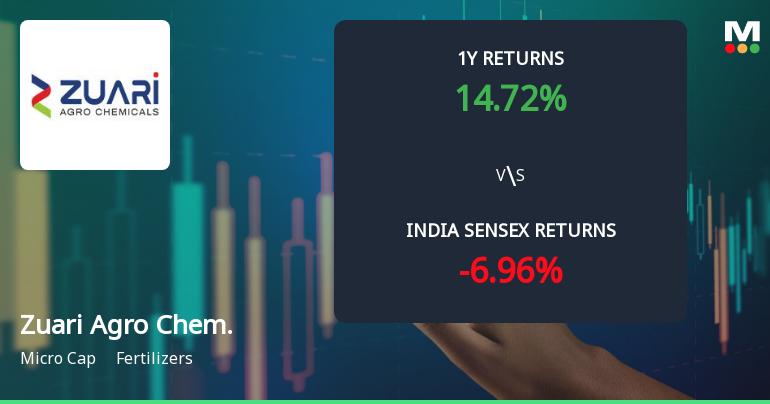
Zuari Agro Chemicals Ltd Technical Momentum Shifts Amid Mixed Indicator Signals
Zuari Agro Chemicals Ltd has experienced a notable shift in its technical momentum, moving from a mildly bearish stance to a sideways trend, reflecting a complex interplay of bullish and bearish signals across key indicators. Despite a recent downgrade to a Strong Sell rating, the stock’s technical landscape reveals nuanced signals that merit close attention from investors and market analysts alike.
Read full news article Announcements
Zuari Agro Chemicals Limited - Other General Purpose
22-Nov-2019 | Source : NSEZuari Agro Chemicals Limited has informed the Exchange regarding Disclosure under Reg 23(9) of SEBI(LODR)Regulations, 2015.
Zuari Agro Chemicals Limited - Outcome of Board Meeting
14-Nov-2019 | Source : NSEZuari Agro Chemicals Limited has informed the Exchange regarding Board meeting held on November 14, 2019.
Zuari Agro Chemicals Limited - Outcome of Board Meeting
25-Oct-2019 | Source : NSEZuari Agro Chemicals Limited has informed the Exchange regarding Board meeting held on October 25, 2019.
Corporate Actions

No Upcoming Board Meetings

Zuari Agro Chemicals Ltd has declared 10% dividend, ex-date: 13 Jul 17

No Splits history available

No Bonus history available

No Rights history available
Quality key factors
Valuation key factors
Technicals key factors
 Technical Indicator Scale: Bearish, Mildly Bearish, Sideways, Mildly Bullish, Bullish Turned
 Shareholding Snapshot : Mar 2026
Shareholding Compare (%holding)
Promoters
26.5412
Held by 0 Schemes
Held by 29 FIIs (2.83%)
Zuari Industries Limited (formerly Zuari Global Limited) (20.0%)
Sushil Kumar Jalani (1.19%)
26.83%
Quarterly Results Snapshot (Consolidated) - Mar'26 - QoQ

QoQ Growth in quarter ended Mar 2026 is -45.50% vs -75.84% in Dec 2025

QoQ Growth in quarter ended Mar 2026 is -163.08% vs -95.08% in Dec 2025
Half Yearly Results Snapshot (Consolidated) - Sep'25
Growth in half year ended Sep 2025 is 20.21% vs -22.23% in Sep 2024
Growth in half year ended Sep 2025 is 901.37% vs 704.90% in Sep 2024
Nine Monthly Results Snapshot (Consolidated) - Dec'25
YoY Growth in nine months ended Dec 2025 is -13.54% vs -5.78% in Dec 2024
YoY Growth in nine months ended Dec 2025 is 551.96% vs 488.15% in Dec 2024
Annual Results Snapshot (Consolidated) - Mar'26
YoY Growth in year ended Mar 2026 is -27.87% vs -3.47% in Mar 2025
YoY Growth in year ended Mar 2026 is 458.24% vs 65.08% in Mar 2025
About Zuari Agro Chemicals Ltd

Company Coordinates


