
Compare Madras Fertilize with Similar Stocks
Stock DNA
Fertilizers
INR 1,100 Cr (Micro Cap)
12.00
23
0.00%
-0.24
95.89%
11.87
Total Returns (Price + Dividend) 
Madras Fertilize for the last several years.
Risk Adjusted Returns v/s
Returns Beta

News
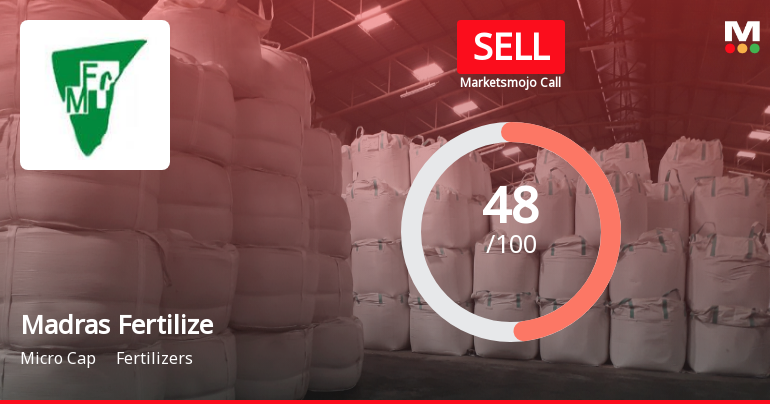
Madras Fertilizers Ltd Downgraded to Sell Amid Mixed Financial and Valuation Signals
Madras Fertilizers Ltd, a micro-cap player in the fertilisers sector, has seen its investment rating downgraded from Hold to Sell as of 10 June 2026. This change reflects a nuanced assessment across four critical parameters: quality, valuation, financial trend, and technicals. Despite some encouraging quarterly results and attractive valuation metrics, concerns over long-term growth and market underperformance have weighed heavily on the stock’s outlook.
Read full news article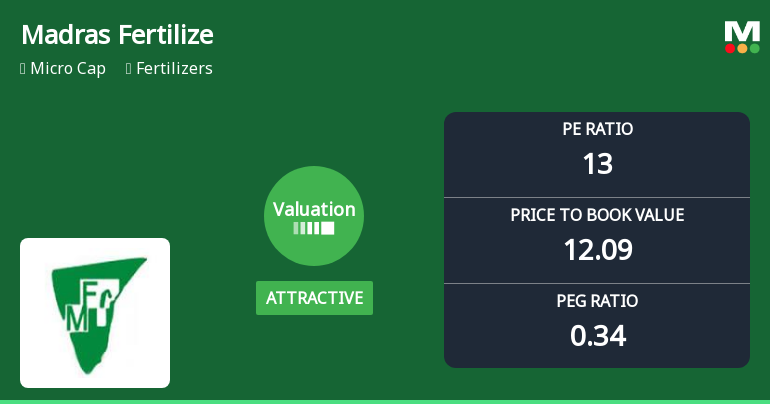
Madras Fertilizers Ltd Valuation Shifts Signal Changing Market Sentiment
Madras Fertilizers Ltd has seen a notable shift in its valuation parameters, moving from a very attractive to an attractive rating, reflecting evolving market perceptions despite recent share price softness and mixed returns relative to the Sensex. This article analyses the key valuation metrics, peer comparisons, and the implications for investors navigating the micro-cap fertiliser sector.
Read full news article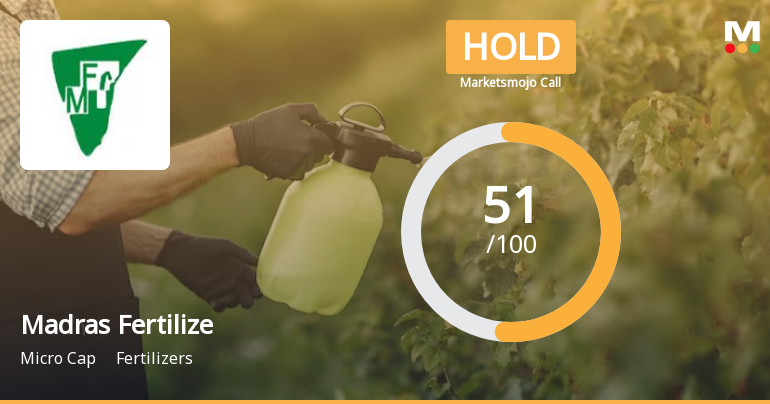
Madras Fertilizers Ltd is Rated Hold
Madras Fertilizers Ltd is rated 'Hold' by MarketsMOJO, with this rating last updated on 19 May 2026. However, the analysis and financial metrics discussed here reflect the stock's current position as of 31 May 2026, providing investors with an up-to-date view of the company’s fundamentals, valuation, financial trends, and technical outlook.
Read full news article Announcements
Clarification sought from Madras Fertilizers Ltd
09-Jan-2026 | Source : BSEThe Exchange has sought clarification from Madras Fertilizers Ltd on January 9 2026 with reference to Movement in Volume.
The reply is awaited.
Madras Fertilizers to conduct board meeting
06-May-2023 | Source : BSEMadras Fertilizers will hold a meeting of the Board of Directors of the Company on 17 May 2023.
Madras Fertilizers to hold board meeting
25-Mar-2023 | Source : BSEMadras Fertilizers will hold a meeting of the Board of Directors of the Company on 31 March 2023.
Corporate Actions

No Upcoming Board Meetings

No Dividend history available

No Splits history available

No Bonus history available

No Rights history available
Quality key factors
Valuation key factors
Technicals key factors
 Technical Indicator Scale: Bearish, Mildly Bearish, Sideways, Mildly Bullish, Bullish Turned
 Shareholding Snapshot : Mar 2026
Shareholding Compare (%holding)
Promoters
None
Held by 1 Schemes (0.0%)
Held by 2 FIIs (0.01%)
The President Of India (59.5%)
None
13.45%
Quarterly Results Snapshot (Standalone) - Mar'26 - QoQ

QoQ Growth in quarter ended Mar 2026 is 67.00% vs -17.96% in Dec 2025
QoQ Growth in quarter ended Mar 2026 is 728.97% vs -80.54% in Dec 2025
Half Yearly Results Snapshot (Standalone) - Sep'25

Growth in half year ended Sep 2025 is -0.43% vs 29.95% in Sep 2024
Growth in half year ended Sep 2025 is 35.54% vs 235.46% in Sep 2024
Nine Monthly Results Snapshot (Standalone) - Dec'25
YoY Growth in nine months ended Dec 2025 is -19.41% vs 35.16% in Dec 2024
YoY Growth in nine months ended Dec 2025 is -48.98% vs 241.03% in Dec 2024
Annual Results Snapshot (Standalone) - Mar'26
YoY Growth in year ended Mar 2026 is -9.47% vs 14.03% in Mar 2025
YoY Growth in year ended Mar 2026 is 25.17% vs 1,055.58% in Mar 2025
About Madras Fertilizers Ltd

Company Coordinates


