
Compare Magadh Sugar with Similar Stocks
Dashboard
Low ability to service debt as the company has a high Debt to EBITDA ratio of 4.70 times
- Low ability to service debt as the company has a high Debt to EBITDA ratio of 4.70 times
Poor long term growth as Net Sales has grown by an annual rate of 5.51% and Operating profit at 4.24% over the last 5 years
Negative results in Mar 26
Despite the size of the company, domestic mutual funds hold only 0.02% of the company
Below par performance in long term as well as near term
Total Returns (Price + Dividend) 
Latest dividend: 12.5 per share ex-dividend date: Jul-18-2025
Risk Adjusted Returns v/s
Returns Beta

News
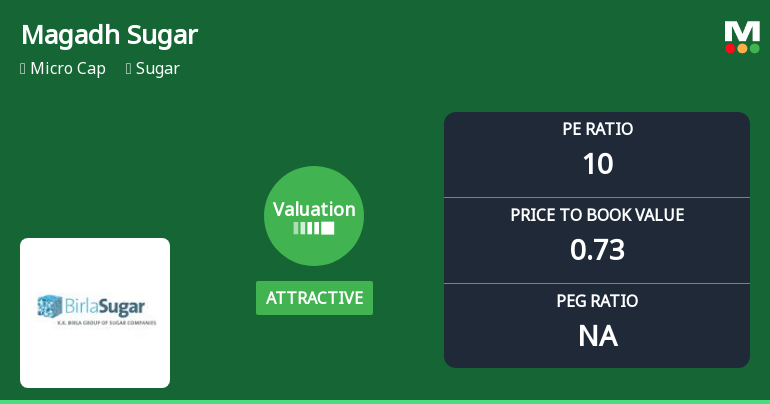
Magadh Sugar & Energy Ltd Valuation Improves Amid Mixed Market Returns
Magadh Sugar & Energy Ltd has witnessed a notable improvement in its valuation parameters, shifting from a very attractive to an attractive rating, despite a challenging year marked by significant stock price declines and sector headwinds. This article analyses the recent changes in key valuation metrics, compares them with peer averages, and assesses the implications for investors navigating the sugar industry landscape.
Read full news article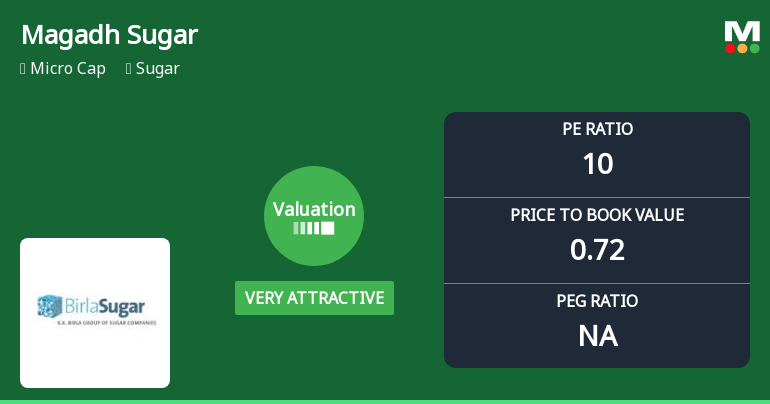
Magadh Sugar & Energy Ltd Valuation Shifts Signal Renewed Price Attractiveness
Magadh Sugar & Energy Ltd has seen a notable shift in its valuation parameters, moving from an attractive to a very attractive rating despite ongoing market headwinds and a challenging sector environment. This change reflects a significant reappraisal of the company’s price-to-earnings and price-to-book ratios relative to its historical averages and peer group, offering investors a fresh perspective on its price attractiveness.
Read full news article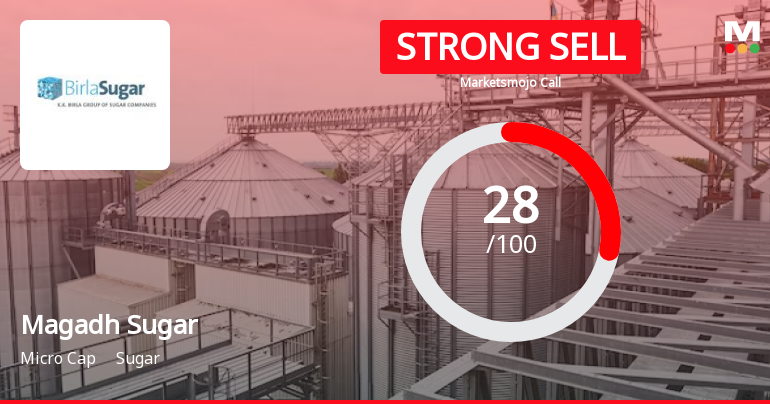
Magadh Sugar & Energy Ltd is Rated Strong Sell
Magadh Sugar & Energy Ltd is rated Strong Sell by MarketsMOJO. This rating was last updated on 01 June 2026, reflecting a reassessment of the stock’s outlook. However, all fundamentals, returns, and financial metrics discussed here are current as of 03 June 2026, providing investors with the latest view of the company’s position in the market.
Read full news article Announcements
Announcement under Regulation 30 (LODR)-Change in Management
08-Jun-2026 | Source : BSEResignation of Senior Management Personnel
Compliances-Reg.24(A)-Annual Secretarial Compliance
29-May-2026 | Source : BSESubmission of Annual Secretarial Compliance Report
Announcement under Regulation 30 (LODR)-Newspaper Publication
12-May-2026 | Source : BSECopy of Newspapare Publication attached
Corporate Actions

No Upcoming Board Meetings

Magadh Sugar & Energy Ltd has declared 125% dividend, ex-date: 18 Jul 25

No Splits history available

Magadh Sugar & Energy Ltd has announced 4:10 bonus issue, ex-date: 27 Jun 19

No Rights history available
Quality key factors
Valuation key factors
Technicals key factors
 Technical Indicator Scale: Bearish, Mildly Bearish, Sideways, Mildly Bullish, Bullish Turned
 Shareholding Snapshot : Mar 2026
Shareholding Compare (%holding)
Promoters
None
Held by 1 Schemes (0.01%)
Held by 4 FIIs (0.18%)
Sil Investments Limited (11.97%)
Navjeewan Medical Institute (5.56%)
28.09%
Quarterly Results Snapshot (Standalone) - Mar'26 - YoY

YoY Growth in quarter ended Mar 2026 is -18.17% vs 23.29% in Mar 2025
YoY Growth in quarter ended Mar 2026 is -32.11% vs 52.54% in Mar 2025
Half Yearly Results Snapshot (Standalone) - Sep'25
Growth in half year ended Sep 2025 is -3.77% vs 15.82% in Sep 2024
Growth in half year ended Sep 2025 is -160.33% vs -45.17% in Sep 2024
Nine Monthly Results Snapshot (Standalone) - Dec'25
YoY Growth in nine months ended Dec 2025 is -1.37% vs 19.62% in Dec 2024
YoY Growth in nine months ended Dec 2025 is -60.57% vs -45.43% in Dec 2024
Annual Results Snapshot (Standalone) - Mar'26
YoY Growth in year ended Mar 2026 is -5.88% vs 20.58% in Mar 2025
YoY Growth in year ended Mar 2026 is -41.97% vs -5.98% in Mar 2025
About Magadh Sugar & Energy Ltd

Company Coordinates


