
Compare Magna Electrocas with Similar Stocks
Stock DNA
Castings & Forgings
INR 453 Cr (Micro Cap)
24.00
45
0.57%
-0.01
12.74%
3.08
Total Returns (Price + Dividend) 
Latest dividend: 6 per share ex-dividend date: Aug-28-2025
Risk Adjusted Returns v/s
Returns Beta

News

Magna Electro Castings Ltd is Rated Hold
Magna Electro Castings Ltd is rated 'Hold' by MarketsMOJO, with this rating last updated on 13 May 2026. However, the analysis and financial metrics discussed below reflect the stock's current position as of 08 June 2026, providing investors with an up-to-date view of the company’s fundamentals, returns, and market standing.
Read full news articleAre Magna Electro Castings Ltd latest results good or bad?
The latest financial results for Magna Electro Castings Ltd for the quarter ending March 2026 indicate a complex operational landscape. The company reported net sales of ₹47.61 crores, reflecting a slight sequential decline of 0.77% compared to the previous quarter, while year-on-year sales growth was recorded at 4.61%. This modest revenue growth, however, is overshadowed by significant challenges in profitability metrics. Net profit for the quarter fell to ₹2.66 crores, marking a substantial decline of 44.87% quarter-on-quarter and 44.81% year-on-year. This decline in profitability is accompanied by a notable contraction in operating margins, which dropped to 13.76%, the lowest level in seven quarters. The profit after tax (PAT) margin also decreased to 5.59%, down from 7.82% in the previous quarter, indicating severe margin compression. The operational challenges are further highlighted by rising employ...
Read full news article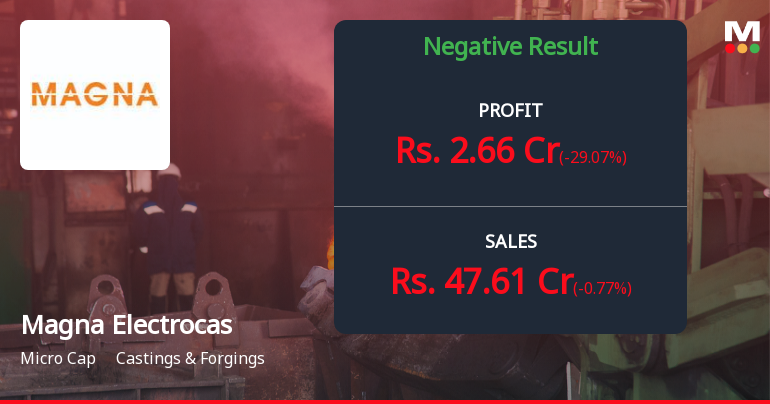
Magna Electro Castings Q4 FY26: Profitability Concerns Cloud Revenue Growth
Magna Electro Castings Ltd., a Coimbatore-based manufacturer of cast iron components, reported a concerning fourth quarter for FY26, with net profit plunging 44.87% quarter-on-quarter to ₹2.66 crores despite modest revenue growth. The micro-cap company, with a market capitalisation of ₹482.00 crores, saw its stock decline 5.00% to ₹1,139.00 in the trading session following the results announcement, reflecting investor disappointment with the sharp deterioration in profitability metrics.
Read full news article Announcements
Announcement under Regulation 30 (LODR)-Newspaper Publication
01-Jun-2026 | Source : BSEEnclosed Newspaper publication regarding opening of Special Window for Transfer and Dematerialisation of physical securities.
Compliances-Reg.24(A)-Annual Secretarial Compliance
30-May-2026 | Source : BSEThe Annual Secretarial Compliance Report for the financial year ended 31st March 2026 is enclosed.
Announcement under Regulation 30 (LODR)-Newspaper Publication
29-May-2026 | Source : BSEPlease find enclosed newspaper publication regarding Financial results for the quarter and year ended 31st March 2026.
Corporate Actions

No Upcoming Board Meetings

Magna Electro Castings Ltd has declared 60% dividend, ex-date: 28 Aug 25

No Splits history available

No Bonus history available

No Rights history available
Quality key factors
Valuation key factors
Technicals key factors
 Technical Indicator Scale: Bearish, Mildly Bearish, Sideways, Mildly Bullish, Bullish Turned
 Shareholding Snapshot : Mar 2026
Shareholding Compare (%holding)
Promoters
None
Held by 0 Schemes
Held by 1 FIIs (0.0%)
N Krishnasamaraj Huf (18.19%)
Elgi Equipments Limited (1.57%)
32.26%
Quarterly Results Snapshot (Standalone) - Mar'26 - QoQ

QoQ Growth in quarter ended Mar 2026 is -0.77% vs -8.31% in Dec 2025
QoQ Growth in quarter ended Mar 2026 is -29.07% vs -30.68% in Dec 2025
Half Yearly Results Snapshot (Standalone) - Sep'25

Growth in half year ended Sep 2025 is 14.86% vs 21.61% in Sep 2024
Growth in half year ended Sep 2025 is -10.19% vs 79.44% in Sep 2024
Nine Monthly Results Snapshot (Standalone) - Dec'25
YoY Growth in nine months ended Dec 2025 is 13.66% vs 21.97% in Dec 2024
YoY Growth in nine months ended Dec 2025 is -13.55% vs 66.06% in Dec 2024
Annual Results Snapshot (Standalone) - Mar'26
YoY Growth in year ended Mar 2026 is 11.33% vs 22.79% in Mar 2025
YoY Growth in year ended Mar 2026 is -20.11% vs 53.01% in Mar 2025
About Magna Electro Castings Ltd

Company Coordinates


