
Compare Mahamaya Steel with Similar Stocks
Dashboard
Weak Long Term Fundamental Strength with an average Return on Capital Employed (ROCE) of 5.57%
- Poor long term growth as Operating profit has grown by an annual rate 15.89% of over the last 5 years
With ROCE of 6.8, it has a Very Expensive valuation with a 7 Enterprise value to Capital Employed
Falling Participation by Institutional Investors
Stock DNA
Iron & Steel Products
INR 1,471 Cr (Micro Cap)
160.00
90
0.00%
0.36
5.73%
8.96
Total Returns (Price + Dividend) 
Mahamaya Steel for the last several years.
Risk Adjusted Returns v/s
Returns Beta

News

Mahamaya Steel Industries Ltd is Rated Sell
Mahamaya Steel Industries Ltd is rated Sell by MarketsMOJO. This rating was last updated on 01 June 2026, reflecting a change from the previous Hold rating. However, all fundamentals, returns, and financial metrics discussed here are current as of 13 June 2026, providing investors with the latest insight into the stock’s position.
Read full news article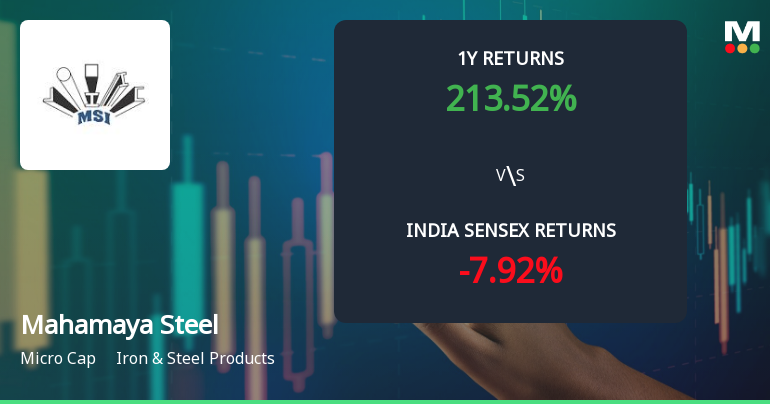
Mahamaya Steel Industries Ltd Technical Momentum Shifts Amid Mixed Signals
Mahamaya Steel Industries Ltd has experienced a notable shift in its technical momentum, moving from a mildly bullish stance to a more confident bullish trend. Despite a slight dip in the stock price on 4 June 2026, the underlying technical indicators reveal a complex interplay of signals that investors should carefully analyse before making decisions.
Read full news article
Mahamaya Steel Industries Ltd Downgraded to Sell Amid Mixed Technicals and Valuation Concerns
Mahamaya Steel Industries Ltd, a micro-cap player in the Iron & Steel Products sector, has seen its investment rating downgraded from Hold to Sell as of 1 June 2026. This shift reflects a complex interplay of factors including a mixed technical outlook, expensive valuation metrics, modest financial trends, and concerns over long-term fundamental strength. Despite strong recent returns, the downgrade signals caution for investors amid deteriorating technical signals and valuation pressures.
Read full news article Announcements
Announcement under Regulation 30 (LODR)-Newspaper Publication
27-May-2026 | Source : BSENewspaper Publication Audited Results 31.03.2026
Board Meeting Outcome for Outcome Of Board Meeting Held On 26.05.2026
26-May-2026 | Source : BSEOutcome of Board Meeting
Audited Financial Results For The Quarter And Year Ended 31.03.2026
26-May-2026 | Source : BSEAudited Financial Results for the quarter and year ended 31.03.2026
Corporate Actions

No Upcoming Board Meetings

Mahamaya Steel Industries Ltd has declared 5% dividend, ex-date: 08 Sep 10

No Splits history available

No Bonus history available

No Rights history available
Quality key factors
Valuation key factors
Technicals key factors
 Technical Indicator Scale: Bearish, Mildly Bearish, Sideways, Mildly Bullish, Bullish Turned
 Shareholding Snapshot : Mar 2026
Shareholding Compare (%holding)
Promoters
None
Held by 0 Schemes
Held by 2 FIIs (0.06%)
Escort Finvest Private Limited (24.95%)
Vijay Rathee (4.67%)
24.16%
Quarterly Results Snapshot (Consolidated) - Mar'26 - QoQ

QoQ Growth in quarter ended Mar 2026 is 17.41% vs 18.85% in Dec 2025

QoQ Growth in quarter ended Mar 2026 is 113.09% vs 1.60% in Dec 2025
Half Yearly Results Snapshot (Consolidated) - Sep'25
Growth in half year ended Sep 2025 is 8.16% vs -9.90% in Sep 2024
Growth in half year ended Sep 2025 is 229.09% vs -65.73% in Sep 2024
Nine Monthly Results Snapshot (Consolidated) - Dec'25
YoY Growth in nine months ended Dec 2025 is 9.57% vs -3.52% in Dec 2024
YoY Growth in nine months ended Dec 2025 is 152.51% vs -58.60% in Dec 2024
Annual Results Snapshot (Consolidated) - Mar'26
YoY Growth in year ended Mar 2026 is 10.11% vs 2.29% in Mar 2025
YoY Growth in year ended Mar 2026 is 26.32% vs 13.10% in Mar 2025
About Mahamaya Steel Industries Ltd

Company Coordinates


