
Compare M T N L with Similar Stocks
Dashboard
With a Negative Book Value, the company has a Weak Long Term Fundamental Strength
- Poor long term growth as Net Sales has grown by an annual rate of -7.69% and Operating profit at 0% over the last 5 years
- The company has a negative book value of Rs 29,959.74 crore
Risky - Negative EBITDA
Despite the size of the company, domestic mutual funds hold only 0% of the company
Underperformed the market in the last 1 year
Stock DNA
Telecom - Services
INR 1,932 Cr (Small Cap)
NA (Loss Making)
39
0.00%
-1.16
10.37%
-0.07
Total Returns (Price + Dividend) 
Latest dividend: 1.0000 per share ex-dividend date: Sep-17-2009
Risk Adjusted Returns v/s
Returns Beta

News

Mahanagar Telephone Nigam Ltd Technical Momentum Shifts Amid Mixed Signals
Mahanagar Telephone Nigam Ltd (MTNL) has experienced a subtle but notable shift in its technical momentum, moving from a sideways trend to a mildly bearish stance. Despite a modest day gain of 0.57% to close at ₹32.00, the stock’s technical indicators present a complex picture, with mixed signals across weekly and monthly timeframes that warrant close attention from investors and analysts alike.
Read full news article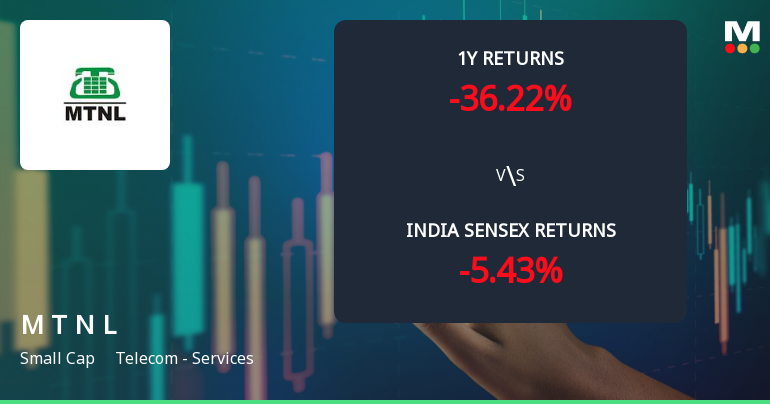
Mahanagar Telephone Nigam Ltd Technical Momentum Shifts Amid Mixed Market Signals
Mahanagar Telephone Nigam Ltd (MTNL) has exhibited a notable shift in its technical momentum, moving from a mildly bearish stance to a sideways trend, reflecting a complex interplay of bullish and bearish signals across key technical indicators. Despite a recent 2.91% rise in the stock price to ₹32.16, the company remains graded as a Strong Sell by MarketsMOJO, underscoring persistent fundamental challenges amid fluctuating market sentiment.
Read full news article
Mahanagar Telephone Nigam Ltd is Rated Strong Sell
Mahanagar Telephone Nigam Ltd is rated Strong Sell by MarketsMOJO. This rating was last updated on 23 July 2025. However, the analysis and financial metrics presented here reflect the company’s current position as of 14 June 2026, providing investors with the latest insights into its performance and outlook.
Read full news article Announcements
COMPLIANCE WITH REGULATION 30 & 51 OF SEBI (LODR) REGULATIONS 2015 - FUNDING OF 11TH SEMI ANNUAL INTEREST IN ESCROW ACCOUNT MAINTAINED IN BANK OF INDIA WRT MTNL BOND SERIES VI (INE153A08097)
19-Jun-2026 | Source : BSELETTER ATTACHED
Disclosures By Listed Entities Of Defaults On Payment Of Interest/ Repayment Of Principal Amount For Loans Including Revolving Facilities Like Cash Credit From Banks / Financial Institutions
16-Jun-2026 | Source : BSEDisclosures by listed entities of defaults on payment of interest/ repayment of principal amount for loans including revolving facilities like cash credit from banks / financial institutions
Closure of Trading Window
11-Jun-2026 | Source : BSELETTER ATTACHED
Corporate Actions

No Upcoming Board Meetings

Mahanagar Telephone Nigam Ltd has declared 10% dividend, ex-date: 17 Sep 09

No Splits history available

No Bonus history available

No Rights history available
Quality key factors
Valuation key factors
Technicals key factors
 Technical Indicator Scale: Bearish, Mildly Bearish, Sideways, Mildly Bullish, Bullish Turned
 Shareholding Snapshot : Mar 2026
Shareholding Compare (%holding)
Promoters
None
Held by 12 Schemes (0.0%)
Held by 11 FIIs (0.51%)
President Of India (56.25%)
Life Insurance Corporation Of India (13.12%)
27.11%
Quarterly Results Snapshot (Consolidated) - Mar'26 - QoQ

QoQ Growth in quarter ended Mar 2026 is 75.93% vs 10.98% in Dec 2025
QoQ Growth in quarter ended Mar 2026 is 65.78% vs 6.59% in Dec 2025
Half Yearly Results Snapshot (Consolidated) - Sep'25

Growth in half year ended Sep 2025 is -37.17% vs 39.79% in Sep 2024
Growth in half year ended Sep 2025 is -14.40% vs -1.15% in Sep 2024
Nine Monthly Results Snapshot (Consolidated) - Dec'25
YoY Growth in nine months ended Dec 2025 is -31.48% vs 38.52% in Dec 2024
YoY Growth in nine months ended Dec 2025 is -12.02% vs -0.65% in Dec 2024
Annual Results Snapshot (Consolidated) - Mar'26
YoY Growth in year ended Mar 2026 is -15.34% vs 41.46% in Mar 2025
YoY Growth in year ended Mar 2026 is 6.62% vs -1.84% in Mar 2025
About Mahanagar Telephone Nigam Ltd

Company Coordinates


