
Compare Sigma Advanced S with Similar Stocks
Stock DNA
Aerospace & Defense
INR 10,204 Cr (Micro Cap)
35.00
44
0.00%
0.66
59.43%
20.75
Total Returns (Price + Dividend) 
Latest dividend: 1.2 per share ex-dividend date: Jun-10-2008
Risk Adjusted Returns v/s
Returns Beta

News
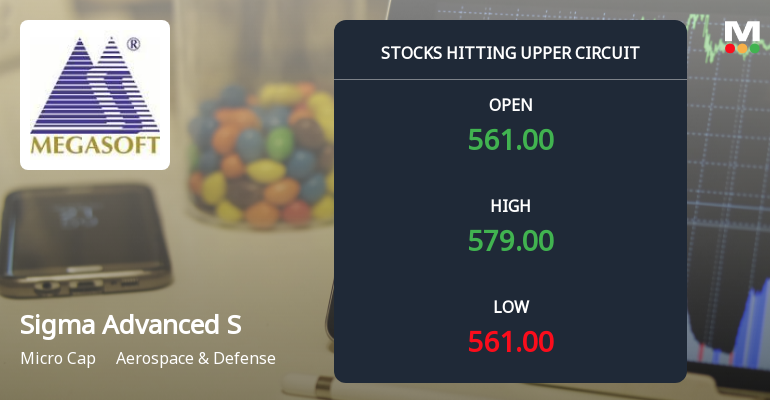
Micro-Cap Sigma Advanced System Ltd Locks at Upper Circuit — Rs 10.25 Crore Turnover and Rising Delivery Tell the Story
At Rs 578.85, the buying was done — not because demand dried up, but because the exchange wouldn't let the stock go any higher. Sigma Advanced System Ltd locked at its upper circuit of 5.0% on 23 Jun 2026, with buyers queuing and no sellers willing to part with shares.
Read full news article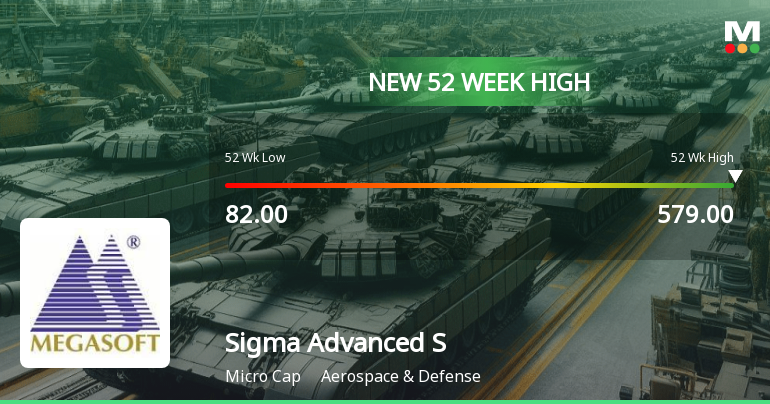
Sigma Advanced System Ltd Hits New 52-Week High of Rs 579 on Back of Strong Technical Signals
From a 52-week low of Rs 82 to a fresh peak of Rs 579, Sigma Advanced System Ltd has surged an extraordinary 547.3% over the past year, cementing its position as a standout performer in the Aerospace & Defense sector. This remarkable rally, culminating in a new all-time high on 23 Jun 2026, is underpinned by a confluence of robust technical indicators and sustained price momentum.
Read full news article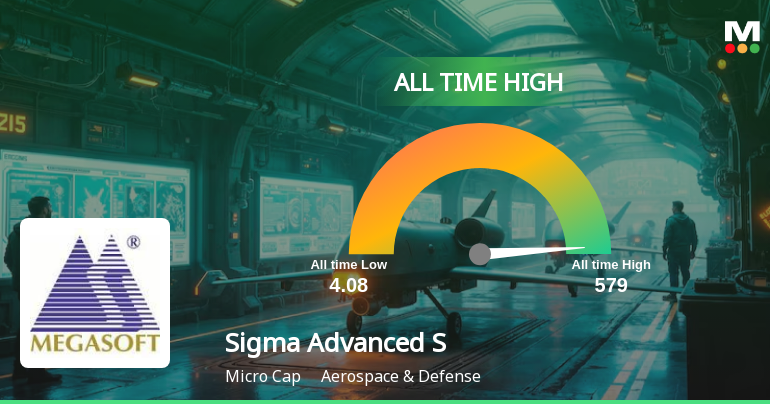
Sigma Advanced System Ltd Hits All-Time High of Rs 579 as Momentum Builds Across Timeframes
Extending its winning streak to six consecutive sessions, Sigma Advanced System Ltd surged 5% today to touch a fresh all-time high of Rs 579, significantly outpacing the Aerospace & Defense sector and broader market indices.
Read full news article Announcements
Corrigendum To The Notice Of The Extra-Ordinary General Meeting (EGM) To Be Held On Sunday The 28Th Day Of June 2026 At 11:00 A.M. (IST) Through Video Conferencing/ Other Audio-Visual Means (VC/OAVM) Dated June 6 2026.
19-Jun-2026 | Source : BSECorrigendum to the Notice of the EGM.
Announcement under Regulation 30 (LODR)-Analyst / Investor Meet - Intimation
16-Jun-2026 | Source : BSEIntimation of Schedule of Analysts/Institutional Investors Meeting under Regulation 30 of the SEBI (Listing Obligations and Disclosure Requirements) Regulations 2015
Announcement under Regulation 30 (LODR)-Press Release / Media Release
08-Jun-2026 | Source : BSEPress Note pursuant to Regulation 30 of SEBI (LODR) Regulations 2015
Corporate Actions

No Upcoming Board Meetings

Sigma Advanced System Ltd has declared 12% dividend, ex-date: 10 Jun 08

No Splits history available

No Bonus history available

Sigma Advanced System Ltd has announced 2:3 rights issue, ex-date: 12 Jul 21
Quality key factors
Valuation key factors
Technicals key factors
 Technical Indicator Scale: Bearish, Mildly Bearish, Sideways, Mildly Bullish, Bullish Turned
 Shareholding Snapshot : Mar 2026
Shareholding Compare (%holding)
Promoters
None
Held by 0 Schemes
Held by 9 FIIs (0.07%)
Chintalapati Holdings Private Limited (46.31%)
None
23.8%
Quarterly Results Snapshot (Consolidated) - Mar'26 - QoQ

QoQ Growth in quarter ended Mar 2026 is 121.56% vs 702.75% in Dec 2025

QoQ Growth in quarter ended Mar 2026 is 12,570.87% vs -124.35% in Dec 2025
Half Yearly Results Snapshot (Consolidated) - Sep'25
Growth in half year ended Sep 2025 is 0.00% vs 0.00% in Sep 2024
Growth in half year ended Sep 2025 is 540.69% vs -16,436.84% in Sep 2024
Nine Monthly Results Snapshot (Consolidated) - Dec'25
YoY Growth in nine months ended Dec 2025 is 667.25% vs 0.00% in Dec 2024
YoY Growth in nine months ended Dec 2025 is 672.10% vs -414.75% in Dec 2024
Annual Results Snapshot (Consolidated) - Mar'26
YoY Growth in year ended Mar 2026 is 358.16% vs 0.00% in Mar 2025
YoY Growth in year ended Mar 2026 is 2,017.31% vs -9.65% in Mar 2025
About Sigma Advanced System Ltd

Company Coordinates


