
Compare Mah. Scooters with Similar Stocks
Stock DNA
Holding Company
INR 14,309 Cr (Small Cap)
51.00
21
1.73%
0.00
1.01%
0.53
Total Returns (Price + Dividend) 
Latest dividend: 59.96 per share ex-dividend date: Jun-30-2026
Risk Adjusted Returns v/s
Returns Beta

News
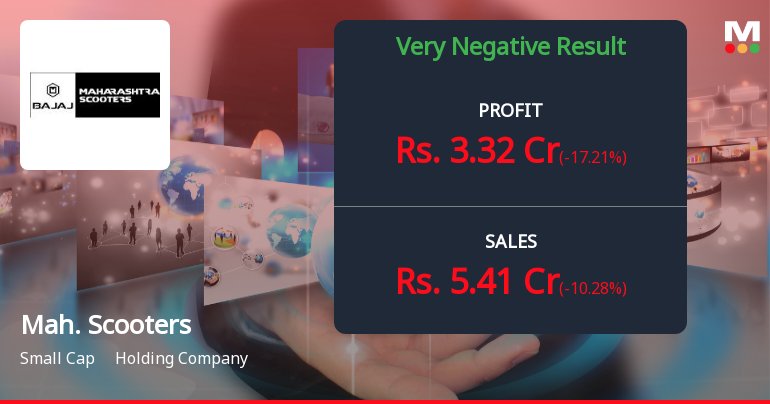
Maharashtra Scooters Q1 FY27: Revenue Plunge Raises Serious Concerns About Business Model Sustainability
Maharashtra Scooters Ltd., the Pune-based holding company majority-owned by Bajaj Holdings & Investment Limited, reported deeply concerning Q1 FY27 results that have intensified questions about the viability of its current business operations. The company posted a net profit of ₹3.32 crores for the quarter ended June 2026, representing a sharp 17.21% decline quarter-on-quarter and a catastrophic 90.61% collapse year-on-year.
Read full news article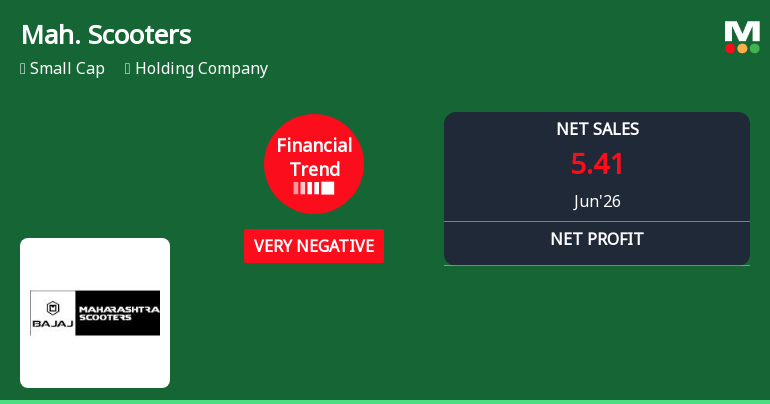
Maharashtra Scooters Ltd Reports Sharp Financial Decline in Q1 2026 Amid Market Volatility
Maharashtra Scooters Ltd has experienced a significant downturn in its latest quarterly financial results, with key performance indicators showing marked deterioration compared to previous periods. The company’s financial trend has shifted from flat to very negative, reflecting challenges in revenue generation, profitability, and operational efficiency during the quarter ended June 2026.
Read full news article
Maharashtra Scooters Ltd is Rated Sell
Maharashtra Scooters Ltd is rated 'Sell' by MarketsMOJO, with this rating last updated on 12 Jan 2026. However, the analysis and financial metrics discussed here reflect the stock's current position as of 27 July 2026, providing investors with an up-to-date view of the company’s performance and outlook.
Read full news article Announcements
Maharashtra Scooters Limited - Updates
18-Nov-2019 | Source : NSEMaharashtra Scooters Limited has informed the Exchange regarding 'Approval for the re-appointment of Shri Yogesh J.Shah and Shri Naresh Patni as Independent Directors for the second term of five (5) years, subject to the approval of shareholders by Special Resolution through Postal Ballot'.
Shareholders meeting
12-Sep-2019 | Source : NSE
| Maharashtra Scooters Limited has submitted the Exchange a copy Srutinizers report of Postal Ballot |
Updates
11-Sep-2019 | Source : NSE
| Maharashtra Scooters Limited has informed the Exchange regarding 'Submission of Scrutinizer Report and Postal Ballot Results '. |
Corporate Actions

No Upcoming Board Meetings

Maharashtra Scooters Ltd has declared 600% dividend, ex-date: 30 Jun 26

No Splits history available

No Bonus history available

No Rights history available
Quality key factors
Valuation key factors
Technicals key factors
 Technical Indicator Scale: Bearish, Mildly Bearish, Sideways, Mildly Bullish, Bullish Turned
 Shareholding Snapshot : Jun 2026
Shareholding Compare (%holding)
Promoters
None
Held by 8 Schemes (3.08%)
Held by 91 FIIs (6.17%)
Bajaj Holdings & Investment Limited (51.0%)
Cd Equifinance Private Limited (5.04%)
24.16%
Quarterly Results Snapshot (Standalone) - Jun'26 - QoQ

QoQ Growth in quarter ended Jun 2026 is -10.28% vs -6.37% in Mar 2026
QoQ Growth in quarter ended Jun 2026 is -17.21% vs -2.67% in Mar 2026
Half Yearly Results Snapshot (Standalone) - Sep'25

Growth in half year ended Sep 2025 is 75.72% vs -19.08% in Sep 2024
Growth in half year ended Sep 2025 is 89.71% vs -19.57% in Sep 2024
Nine Monthly Results Snapshot (Standalone) - Dec'25
YoY Growth in nine months ended Dec 2025 is 73.61% vs -18.79% in Dec 2024
YoY Growth in nine months ended Dec 2025 is 88.39% vs -18.32% in Dec 2024
Annual Results Snapshot (Standalone) - Mar'26
YoY Growth in year ended Mar 2026 is 70.60% vs -17.69% in Mar 2025
YoY Growth in year ended Mar 2026 is 44.88% vs 7.55% in Mar 2025
About Maharashtra Scooters Ltd

Company Coordinates


