
Compare Mahindra EPC with Similar Stocks
Dashboard
Weak Long Term Fundamental Strength with a -4.23% CAGR growth in Operating Profits over the last 5 years
- Company's ability to service its debt is weak with a poor EBIT to Interest (avg) ratio of -0.04
- The company has been able to generate a Return on Equity (avg) of 2.57% signifying low profitability per unit of shareholders funds
Below par performance in long term as well as near term
Stock DNA
Industrial Manufacturing
INR 301 Cr (Micro Cap)
21.00
35
0.00%
0.24
7.66%
1.61
Total Returns (Price + Dividend) 
Latest dividend: 1.2 per share ex-dividend date: Jul-14-2021
Risk Adjusted Returns v/s
Returns Beta

News

Mahindra EPC Irrigation Ltd Downgraded to Strong Sell Amid Technical and Fundamental Concerns
Mahindra EPC Irrigation Ltd has seen its investment rating downgraded from Sell to Strong Sell as of 1 June 2026, reflecting deteriorating technical indicators and persistent fundamental weaknesses despite recent positive quarterly results. The downgrade is driven by a comprehensive reassessment across quality, valuation, financial trends, and technical parameters, signalling caution for investors in this micro-cap industrial manufacturing stock.
Read full news article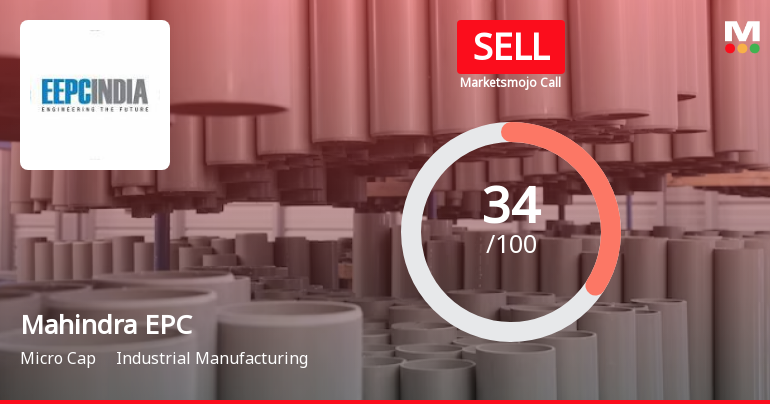
Mahindra EPC Irrigation Ltd is Rated Sell
Mahindra EPC Irrigation Ltd is rated 'Sell' by MarketsMOJO, with this rating last updated on 29 Apr 2026. However, the analysis and financial metrics discussed here reflect the stock's current position as of 22 May 2026, providing investors with an up-to-date view of the company’s performance and outlook.
Read full news article
Mahindra EPC Irrigation Ltd is Rated Sell
Mahindra EPC Irrigation Ltd is rated 'Sell' by MarketsMOJO, with this rating last updated on 29 April 2026. While the rating was revised on that date, the analysis and financial metrics discussed here reflect the stock’s current position as of 11 May 2026, providing investors with an up-to-date view of the company’s fundamentals, valuation, financial trends, and technical outlook.
Read full news article Announcements
Shareholder Meeting / Postal Ballot-Scrutinizers Report
01-Jun-2026 | Source : BSEMahindra EPC Irrigation Limited has submitted the Exchange a copy of the Scrutinizers report of the 44th Annual General Meeting held on Friday May 29 2026. Further the company has informed the Exchange regarding voting results.
Shareholder Meeting / Postal Ballot-Outcome of AGM
29-May-2026 | Source : BSEPursuant to Regulation 30 of SEBI (LODR) Regulations 2015 read with para-A of Schedule III please find enclosed the proceedings of the 44th Annual General Meeting of the Company.
Announcement under Regulation 30 (LODR)-Analyst / Investor Meet - Intimation
25-May-2026 | Source : BSEMahindra EPC Irrigation Limited has informed the exchange about schedule of conference call with analyst/ investors on Friday 29th May 2026 at 4.00 p.m. (IST) pursuant to Regulation 30 of the SEBI (Listing Obligations and Disclosure Requirements) Regulations 2015.
Corporate Actions

No Upcoming Board Meetings

Mahindra EPC Irrigation Ltd has declared 12% dividend, ex-date: 14 Jul 21

No Splits history available

No Bonus history available

Mahindra EPC Irrigation Ltd has announced 3:5 rights issue, ex-date: 02 May 12
Quality key factors
Valuation key factors
Technicals key factors
 Technical Indicator Scale: Bearish, Mildly Bearish, Sideways, Mildly Bullish, Bullish Turned
 Shareholding Snapshot : Mar 2026
Shareholding Compare (%holding)
Promoters
None
Held by 0 Schemes
Held by 2 FIIs (0.02%)
Mahindra & Mahindra Limited (54.2%)
Rajen Anil Shah (2.48%)
38.18%
Quarterly Results Snapshot (Consolidated) - Mar'26 - QoQ

QoQ Growth in quarter ended Mar 2026 is 14.48% vs 88.52% in Dec 2025
QoQ Growth in quarter ended Mar 2026 is -26.19% vs 1,409.30% in Dec 2025
Half Yearly Results Snapshot (Consolidated) - Sep'25

Growth in half year ended Sep 2025 is 17.09% vs -14.11% in Sep 2024
Growth in half year ended Sep 2025 is 126.16% vs -261.74% in Sep 2024
Nine Monthly Results Snapshot (Consolidated) - Dec'25
YoY Growth in nine months ended Dec 2025 is 16.01% vs -7.58% in Dec 2024
YoY Growth in nine months ended Dec 2025 is 722.92% vs 433.33% in Dec 2024
Annual Results Snapshot (Consolidated) - Mar'26
YoY Growth in year ended Mar 2026 is 14.46% vs 3.89% in Mar 2025
YoY Growth in year ended Mar 2026 is 76.01% vs 331.74% in Mar 2025
About Mahindra EPC Irrigation Ltd

Company Coordinates


