
Compare Mangalam Drugs with Similar Stocks
Dashboard
With a Operating Losses, the company has a Weak Long Term Fundamental Strength
- Company's ability to service its debt is weak with a poor EBIT to Interest (avg) ratio of -0.37
- The company has been able to generate a Return on Equity (avg) of 2.26% signifying low profitability per unit of shareholders funds
With a fall in Operating Profit of -2240.95%, the company declared Very Negative results in Mar 26
Risky - Negative EBITDA
Consistent Underperformance against the benchmark over the last 3 years
Stock DNA
Pharmaceuticals & Biotechnology
INR 47 Cr (Micro Cap)
NA (Loss Making)
34
0.00%
1.02
-43.09%
0.46
Total Returns (Price + Dividend) 
Latest dividend: 0.5 per share ex-dividend date: Dec-21-2017
Risk Adjusted Returns v/s
Returns Beta

News
Mangalam Drugs and Organics Ltd is Rated Strong Sell
Mangalam Drugs and Organics Ltd is rated Strong Sell by MarketsMOJO, with this rating last updated on 19 May 2025. However, the analysis and financial metrics discussed here reflect the stock’s current position as of 18 June 2026, providing investors with an up-to-date view of the company’s fundamentals, returns, and market standing.
Read full news article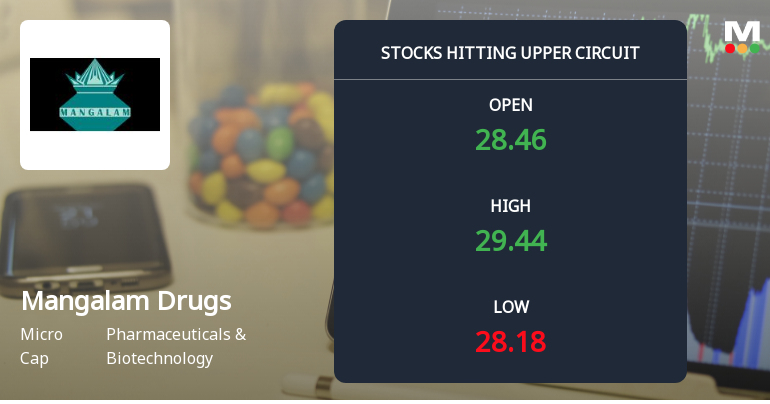
Mangalam Drugs and Organics Ltd Locks at Upper Circuit With 1.88% Gain — Buyers Queue, Sellers Absent
At Rs 29.58, the buying was done — not because demand dried up, but because the exchange wouldn't let the stock go any higher. Mangalam Drugs and Organics Ltd locked at its upper circuit of 5% on 15 Jun 2026, with buyers queuing and no sellers willing to part with shares.
Read full news article
Mangalam Drugs and Organics Ltd is Rated Strong Sell
Mangalam Drugs and Organics Ltd is rated Strong Sell by MarketsMOJO. This rating was last updated on 19 May 2025. However, the analysis and financial metrics presented here reflect the company’s current position as of 08 June 2026, providing investors with an up-to-date view of its fundamentals, returns, and overall market standing.
Read full news article Announcements
Shareholder Meeting / Postal Ballot-Scrutinizers Report
18-Jun-2026 | Source : BSEDisclosure of Voting Results and Scrutinizers Report for Postal ballot pursuant to Regulation 44 (3) of SEBI LODR 2025 for re-appointment of Mr. Praveen Saxena as an Independent Director for second term of 5 years.
Shareholder Meeting / Postal Ballot-Outcome of Postal_Ballot
18-Jun-2026 | Source : BSEDisclosure of Voting Results and Scrutinizers Report for Postal ballot pursuant to Regulation 44 (3) of SEBI LODR 2025 for re-appointment of Mr. Praveen Saxena as an Independent Director for second term of 5 years.
Defaults under Para A sub-paragraph 6 of Schedule III-Subsequent Disclosure
17-Jun-2026 | Source : BSESubsequent Disclosure under Regulation 30 part A of Schedule III of SEBI (Listing Obligation and Discloure Requirements) Regulations 2015 of default of Bank Loan account.
Corporate Actions

No Upcoming Board Meetings

Mangalam Drugs and Organics Ltd has declared 5% dividend, ex-date: 21 Dec 17

No Splits history available

No Bonus history available

No Rights history available
Quality key factors
Valuation key factors
Technicals key factors
 Technical Indicator Scale: Bearish, Mildly Bearish, Sideways, Mildly Bullish, Bullish Turned
 Shareholding Snapshot : Mar 2026
Shareholding Compare (%holding)
Non Institution
None
Held by 0 Schemes
Held by 3 FIIs (0.32%)
Shree Rasbihari Trading & Investment Pvt Ltd (6.21%)
Thakkalapalli Sampath Rao (1.03%)
60.14%
Quarterly Results Snapshot (Consolidated) - Mar'26 - QoQ

QoQ Growth in quarter ended Mar 2026 is 15.26% vs 17.84% in Dec 2025
QoQ Growth in quarter ended Mar 2026 is -36.38% vs -33.88% in Dec 2025
Half Yearly Results Snapshot (Consolidated) - Sep'25
Growth in half year ended Sep 2025 is -31.69% vs -7.42% in Sep 2024
Growth in half year ended Sep 2025 is -493.67% vs 140.99% in Sep 2024
Nine Monthly Results Snapshot (Consolidated) - Dec'25
YoY Growth in nine months ended Dec 2025 is -32.60% vs 3.76% in Dec 2024
YoY Growth in nine months ended Dec 2025 is -565.17% vs 125.11% in Dec 2024
Annual Results Snapshot (Consolidated) - Mar'26
YoY Growth in year ended Mar 2026 is -26.91% vs -13.84% in Mar 2025
YoY Growth in year ended Mar 2026 is -760.71% vs 174.09% in Mar 2025
About Mangalam Drugs and Organics Ltd

Company Coordinates


