
Compare Mangalam Organic with Similar Stocks
Dashboard
Weak Long Term Fundamental Strength with a -12.02% CAGR growth in Operating Profits over the last 5 years
- Low ability to service debt as the company has a high Debt to EBITDA ratio of 4.09 times
- The company has been able to generate a Return on Equity (avg) of 6.49% signifying low profitability per unit of shareholders funds
Positive results in Mar 26
With ROCE of 8.9, it has a Attractive valuation with a 1.3 Enterprise value to Capital Employed
Majority shareholders : Promoters
Market Beating performance in long term as well as near term
Stock DNA
Commodity Chemicals
INR 476 Cr (Micro Cap)
17.00
46
0.00%
1.12
8.93%
1.52
Total Returns (Price + Dividend) 
Latest dividend: 1.4881175468483818 per share ex-dividend date: Sep-20-2022
Risk Adjusted Returns v/s
Returns Beta

News
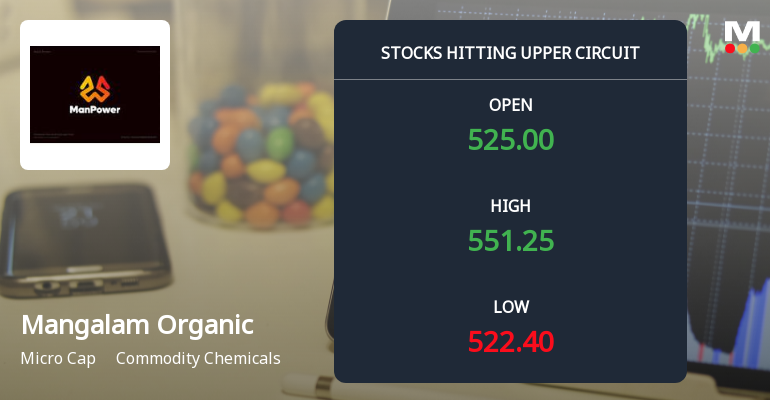
Mangalam Organics Ltd Locks at Upper Circuit With 5.0% Gain — Buyers Queue, Sellers Absent
At Rs 547.45, the buying was done — not because demand dried up, but because the exchange wouldn't let the stock go any higher. Mangalam Organics Ltd locked at its upper circuit of 5.0% on 15 Jul 2026, with buyers queuing and no sellers willing to part with shares.
Read full news article
Mangalam Organics Ltd is Rated Hold by MarketsMOJO
Mangalam Organics Ltd is rated 'Hold' by MarketsMOJO, with this rating last updated on 05 June 2026. However, the analysis and financial metrics discussed here reflect the company’s current position as of 11 July 2026, providing investors with the latest insights into its performance and outlook.
Read full news article
Mangalam Organics Ltd is Rated Hold by MarketsMOJO
Mangalam Organics Ltd is rated 'Hold' by MarketsMOJO, with this rating last updated on 05 June 2026. However, the analysis and financial metrics presented here reflect the stock's current position as of 30 June 2026, providing investors with an up-to-date view of the company’s fundamentals, valuation, financial trends, and technical outlook.
Read full news article Announcements
Compliances-Certificate under Reg. 74 (5) of SEBI (DP) Regulations 2018
04-Jul-2026 | Source : BSEConfirmation certificate under Reg 74 (5) of SEBI (DP) Regulations 2018 for the quarter ended June 2026.
Announcement under Regulation 30 (LODR)-Strikes /Lockouts / Disturbances
03-Jul-2026 | Source : BSEIn continuation of our letter dated July 17 2025 regarding the fire incident that occured on July 16 2025 we wish to inform you that the appointed Insurer surveyor has submitted the surveyor report to the Insurer company the details regarding the same is attached for your reference.
Announcement under Regulation 30 (LODR)-Credit Rating
01-Jul-2026 | Source : BSEWe wish to inform you that the CRISIL Ratings Limited has reviewed and upgraded the rating assigned to the Company.
Corporate Actions

No Upcoming Board Meetings

Mangalam Organics Ltd has declared 15% dividend, ex-date: 20 Sep 22

No Splits history available

No Bonus history available

No Rights history available
Quality key factors
Valuation key factors
Technicals key factors
 Technical Indicator Scale: Bearish, Mildly Bearish, Sideways, Mildly Bullish, Bullish Turned
 Shareholding Snapshot : Mar 2026
Shareholding Compare (%holding)
Promoters
None
Held by 0 Schemes
Held by 0 FIIs
Tradechem Organics Limited (21.36%)
Radhakishan S Damani (2.17%)
27.75%
Quarterly Results Snapshot (Consolidated) - Mar'26 - QoQ

QoQ Growth in quarter ended Mar 2026 is -6.50% vs 3.92% in Dec 2025

QoQ Growth in quarter ended Mar 2026 is 38.11% vs 34.89% in Dec 2025
Half Yearly Results Snapshot (Consolidated) - Sep'25
Growth in half year ended Sep 2025 is 18.87% vs -7.74% in Sep 2024
Growth in half year ended Sep 2025 is 304.19% vs 306.38% in Sep 2024
Nine Monthly Results Snapshot (Consolidated) - Dec'25
YoY Growth in nine months ended Dec 2025 is 23.34% vs -2.11% in Dec 2024
YoY Growth in nine months ended Dec 2025 is 165.01% vs 305.43% in Dec 2024
Annual Results Snapshot (Consolidated) - Mar'26
YoY Growth in year ended Mar 2026 is 17.46% vs 7.39% in Mar 2025
YoY Growth in year ended Mar 2026 is 104.44% vs 193.71% in Mar 2025
About Mangalam Organics Ltd

Company Coordinates


