
Compare Mangalam Organic with Similar Stocks
Dashboard
Weak Long Term Fundamental Strength with a -12.02% CAGR growth in Operating Profits over the last 5 years
- Low ability to service debt as the company has a high Debt to EBITDA ratio of 4.09 times
- The company has been able to generate a Return on Equity (avg) of 6.49% signifying low profitability per unit of shareholders funds
Positive results in Mar 26
With ROCE of 8.9, it has a Attractive valuation with a 1.1 Enterprise value to Capital Employed
Majority shareholders : Promoters
Underperformed the market in the last 1 year
Stock DNA
Commodity Chemicals
INR 406 Cr (Micro Cap)
14.00
41
0.00%
1.12
8.93%
1.22
Total Returns (Price + Dividend) 
Latest dividend: 1.5 per share ex-dividend date: Sep-20-2022
Risk Adjusted Returns v/s
Returns Beta

News
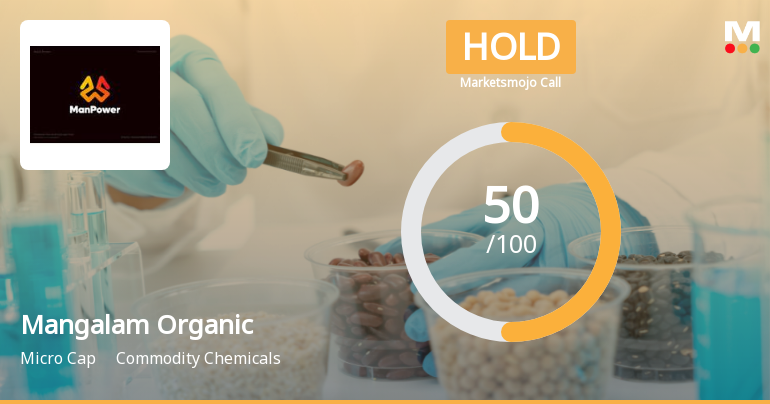
Mangalam Organics Ltd Upgraded to Hold by MarketsMOJO Amid Mixed Fundamentals
Mangalam Organics Ltd, a micro-cap player in the commodity chemicals sector, has seen its investment rating upgraded from Sell to Hold as of 5 June 2026. This change reflects a nuanced reassessment of the company’s quality, valuation, financial trends, and technical indicators amid a challenging market backdrop and mixed operational performance.
Read full news article
Mangalam Organics Ltd Locks at Lower Circuit With 5.0% Loss — Sellers Queue, No Buyers in Sight
At Rs 470.35, sellers were still queuing — but there were no buyers willing to take the other side. Mangalam Organics Ltd locked at its lower circuit of 5.0% on 4 Jun 2026, with unfilled sell orders and a frozen price.
Read full news article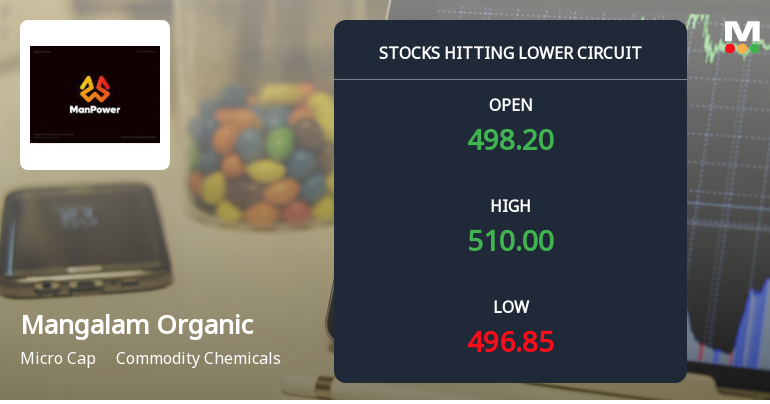
Mangalam Organics Ltd Locks at Lower Circuit With 5.0% Loss — Sellers Queue, No Buyers in Sight
At Rs 495.10, sellers were still queuing — but there were no buyers willing to take the other side. Mangalam Organics Ltd locked at its lower circuit of 5.0% on 3 Jun 2026, with unfilled sell orders and a frozen price, signalling a pronounced imbalance in supply and demand.
Read full news article Announcements
Announcement under Regulation 30 (LODR)-Investor Presentation
01-Jun-2026 | Source : BSEInvestor Presentation for the quarter and year ended March 2026.
Announcement under Regulation 30 (LODR)-Newspaper Publication
30-May-2026 | Source : BSENewspaper clippings regarding the extract of the Audited Standalone and Consolidated Financial results for the quarter and year ended March 31 2026
Financial Results For 31/03/2026
29-May-2026 | Source : BSEThe Board of Directors at its meeting held today i.e. May 29 2026 has considered and approve the Standalone and Consolidated Audited Financial Results for the quarter and year ended March 31 2026 as reviewed and recommended by Audit committee along with the Auditor Report with unmodified opinion given by Statutory Auditors of the Company.
Corporate Actions

No Upcoming Board Meetings

Mangalam Organics Ltd has declared 15% dividend, ex-date: 20 Sep 22

No Splits history available

No Bonus history available

No Rights history available
Quality key factors
Valuation key factors
Technicals key factors
 Technical Indicator Scale: Bearish, Mildly Bearish, Sideways, Mildly Bullish, Bullish Turned
 Shareholding Snapshot : Mar 2026
Shareholding Compare (%holding)
Promoters
None
Held by 0 Schemes
Held by 0 FIIs
Tradechem Organics Limited (21.36%)
Radhakishan S Damani (2.17%)
27.75%
Quarterly Results Snapshot (Consolidated) - Mar'26 - QoQ

QoQ Growth in quarter ended Mar 2026 is -6.50% vs 3.92% in Dec 2025

QoQ Growth in quarter ended Mar 2026 is 38.11% vs 34.89% in Dec 2025
Half Yearly Results Snapshot (Consolidated) - Sep'25
Growth in half year ended Sep 2025 is 18.87% vs -7.74% in Sep 2024
Growth in half year ended Sep 2025 is 304.19% vs 306.38% in Sep 2024
Nine Monthly Results Snapshot (Consolidated) - Dec'25
YoY Growth in nine months ended Dec 2025 is 23.34% vs -2.11% in Dec 2024
YoY Growth in nine months ended Dec 2025 is 165.01% vs 305.43% in Dec 2024
Annual Results Snapshot (Consolidated) - Mar'26
YoY Growth in year ended Mar 2026 is 17.46% vs 7.39% in Mar 2025
YoY Growth in year ended Mar 2026 is 104.44% vs 193.71% in Mar 2025
About Mangalam Organics Ltd

Company Coordinates


