
Compare Mangalam World. with Similar Stocks
Dashboard
Healthy long term growth as Operating profit has grown by an annual rate 62.88%
The company has declared Positive results for the last 3 consecutive quarters
With ROCE of 15.2, it has a Expensive valuation with a 2.5 Enterprise value to Capital Employed
Despite the size of the company, domestic mutual funds hold only 0% of the company
Stock DNA
Iron & Steel Products
INR 1,117 Cr (Micro Cap)
22.00
26
0.05%
0.77
16.72%
3.72
Total Returns (Price + Dividend) 

Risk Adjusted Returns v/s
Returns Beta
News
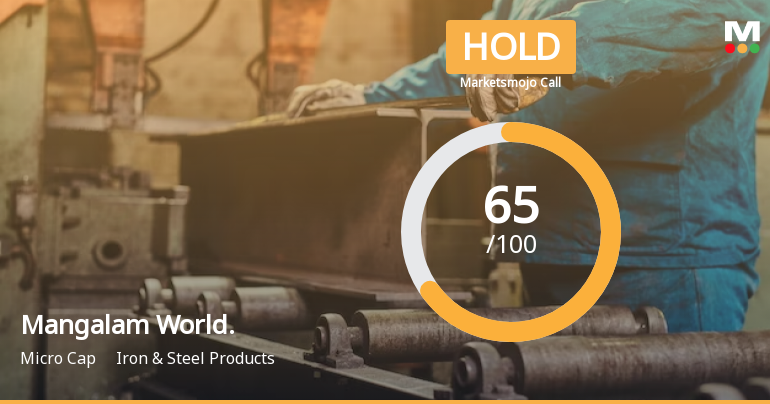
Mangalam Worldwide Ltd is Rated Hold by MarketsMOJO
Mangalam Worldwide Ltd is rated 'Hold' by MarketsMOJO, with this rating last updated on 30 April 2026. However, the analysis and financial metrics discussed here reflect the stock's current position as of 08 June 2026, providing investors with an up-to-date view of the company’s fundamentals, valuation, financial trends, and technical outlook.
Read full news article
Mangalam Worldwide Ltd Technical Momentum Shifts to Bullish Amid Mixed Indicators
Mangalam Worldwide Ltd, a micro-cap player in the Iron & Steel Products sector, has recently experienced a notable shift in its technical momentum, moving from a mildly bullish stance to a more confident bullish trend. This transition is underscored by a combination of technical indicators, including MACD, RSI, moving averages, and Bollinger Bands, which collectively paint a nuanced picture of the stock’s near-term prospects.
Read full news article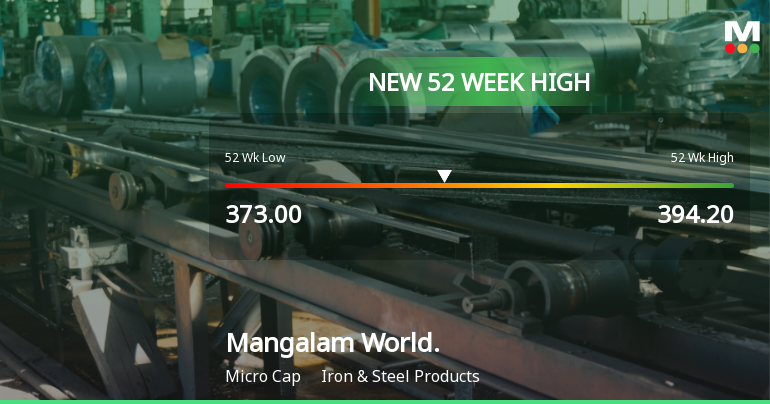
Broad-Based Technical Strength Lifts Mangalam Worldwide Ltd to 52-Week High of Rs 394.2
With a decisive surge to Rs 394.2 on 2 Jun 2026, Mangalam Worldwide Ltd has reached a fresh 52-week and all-time high, marking a significant milestone in its price momentum. This breakout comes amid a backdrop of strong technical signals across multiple timeframes, underscoring the stock’s robust upward trajectory despite a broadly cautious market environment.
Read full news article Announcements
Announcement under Regulation 30 (LODR)-Change in Management
02-Jun-2026 | Source : BSEIntimation for appointment of Mr. Pankaj Kumar Sahay as a Senior Managerial Personnel by the Company.
Intimation Regarding Proposed Incorporation Of A Wholly Owned Subsidiary/ Subsidiary In Belgium/Netherlands Or In Another Country In Europe
01-Jun-2026 | Source : BSEIntimation regarding Proposed Incorporation of a Wholly Owned Subsidiary/ subsidiary in Belgium/Netherlands or in another Country in Europe
Announcement under Regulation 30 (LODR)-Press Release / Media Release
01-Jun-2026 | Source : BSEPress Release regarding the issuance of a Rs 5 commemorative postage stamp by the Government of India in honour of Late Shri Tejmal Ji Mangal founder of the Mangal Family Business Legacy
Corporate Actions

No Upcoming Board Meetings

Mangalam Worldwide Ltd has declared 2% dividend, ex-date: 18 Jul 25

No Splits history available

No Bonus history available

No Rights history available
Quality key factors
Valuation key factors
Technicals key factors
 Technical Indicator Scale: Bearish, Mildly Bearish, Sideways, Mildly Bullish, Bullish Turned
 Shareholding Snapshot : Mar 2026
Shareholding Compare (%holding)
Promoters
11.6447
Held by 0 Schemes
Held by 3 FIIs (0.01%)
Chandragupt Prakash Mangal (20.63%)
Kiran Jain (1.85%)
23.57%
Quarterly Results Snapshot (Consolidated) - Mar'26 - QoQ

QoQ Growth in quarter ended Mar 2026 is -24.34% vs 10.43% in Dec 2025
QoQ Growth in quarter ended Mar 2026 is 9.24% vs 33.49% in Dec 2025
Half Yearly Results Snapshot (Consolidated) - Sep'25

Growth in half year ended Sep 2025 is 26.98% vs 16.58% in Sep 2024
Growth in half year ended Sep 2025 is 59.66% vs 153.73% in Sep 2024
Nine Monthly Results Snapshot (Consolidated) - Dec'25
YoY Growth in nine months ended Dec 2025 is 28.01% vs 26.68% in Dec 2024
YoY Growth in nine months ended Dec 2025 is 65.38% vs 88.17% in Dec 2024
Annual Results Snapshot (Consolidated) - Mar'26
YoY Growth in year ended Mar 2026 is 13.88% vs 29.65% in Mar 2025
YoY Growth in year ended Mar 2026 is 69.95% vs 35.04% in Mar 2025
About Mangalam Worldwide Ltd

Company Coordinates


