
Compare Rajputana Stain. with Similar Stocks
Stock DNA
Iron & Steel Products
INR 1,053 Cr (Small Cap)
23.00
26
0.00%
-0.18
13.71%
2.95
Total Returns (Price + Dividend) 

Risk Adjusted Returns v/s
Returns Beta
News

Rajputana Stainless Ltd Technical Momentum Shifts Amid Market Pressure
Rajputana Stainless Ltd, a small-cap player in the Iron & Steel Products sector, has experienced a notable shift in its technical momentum, moving from a mildly bearish stance to a sideways trend. This transition is underscored by mixed signals from key technical indicators such as MACD, RSI, and moving averages, reflecting a period of consolidation amid broader market pressures.
Read full news article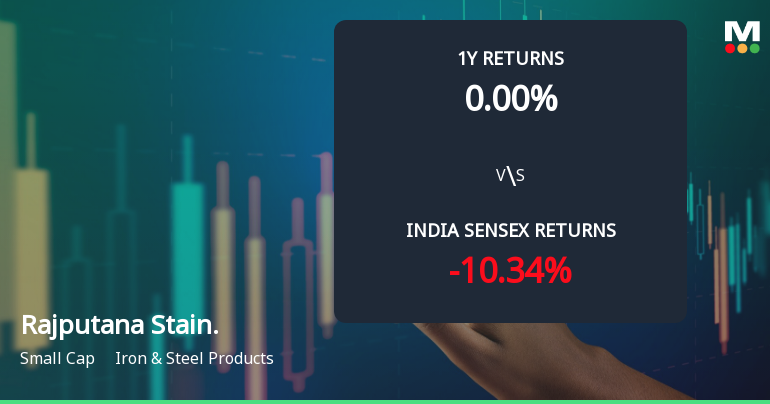
Rajputana Stainless Ltd Technical Momentum Shifts Amid Mildly Bearish Outlook
Rajputana Stainless Ltd, a small-cap player in the Iron & Steel Products sector, has experienced a notable shift in its technical momentum, moving from a sideways trend to a mildly bearish stance. Despite a positive day change of 1.91%, the company’s technical indicators and recent price action suggest caution for investors amid mixed signals from key momentum oscillators and moving averages.
Read full news article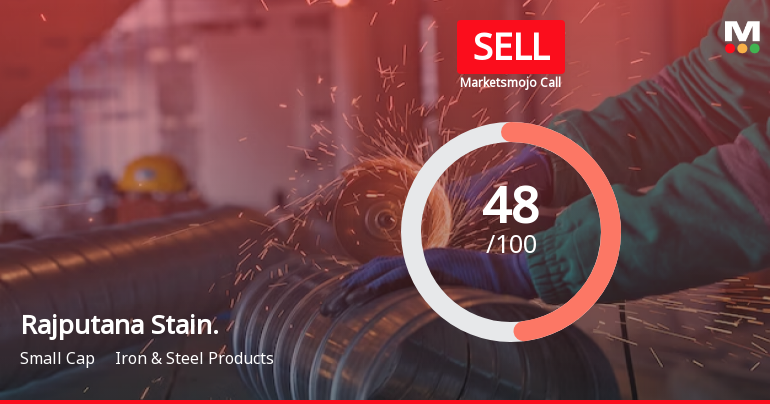
Rajputana Stainless Ltd is Rated Sell
Rajputana Stainless Ltd is rated 'Sell' by MarketsMOJO, with this rating last updated on 26 May 2026. However, the analysis and financial metrics discussed here reflect the stock's current position as of 09 June 2026, providing investors with the latest insights into its performance and outlook.
Read full news article Announcements
Announcement under Regulation 30 (LODR)-Press Release / Media Release
01-Jun-2026 | Source : BSERajputana Stainless Limited Press Release
Statement Of Deviation & Variation
30-May-2026 | Source : BSEStatement of Deviation & Variation
Compliances-Reg.24(A)-Annual Secretarial Compliance
28-May-2026 | Source : BSEAnnual Secretarial Compliance Report
Corporate Actions

No Upcoming Board Meetings

No Dividend history available

No Splits history available

No Bonus history available

No Rights history available
Quality key factors
Valuation key factors
Technicals key factors
 Technical Indicator Scale: Bearish, Mildly Bearish, Sideways, Mildly Bullish, Bullish Turned
 Shareholding Snapshot : Mar 2026
Shareholding Compare (%holding)
Promoters
None
Held by 0 Schemes
Held by 8 FIIs (3.94%)
Shankarlal Deepchand Mehta (37.69%)
Lohagar Developer Private Limited (6.69%)
26.78%
Quarterly Results Snapshot (Standalone) - Mar'26 - QoQ

QoQ Growth in quarter ended Mar 2026 is 1.72% vs -7.19% in Dec 2025
QoQ Growth in quarter ended Mar 2026 is 6.42% vs -6.88% in Dec 2025
Half Yearly Results Snapshot (Standalone) - Sep'25
Not Applicable: The company has declared_date for only one period
Not Applicable: The company has declared_date for only one period
Nine Monthly Results Snapshot (Standalone) - Dec'25
Not Applicable: The company has declared_date for only one period
Not Applicable: The company has declared_date for only one period
Annual Results Snapshot (Standalone) - Mar'26
Not Applicable: The company has declared_date for only one period
Not Applicable: The company has declared_date for only one period
About Rajputana Stainless Ltd

Company Coordinates


